

Question: Program in python 3.x. Please add comments in order to increase understanding of the solution. (If possible try to make the code as simple as
Program in python 3.x. Please add comments in order to increase understanding of the solution. (If possible try to make the code as simple as possible). Thanks
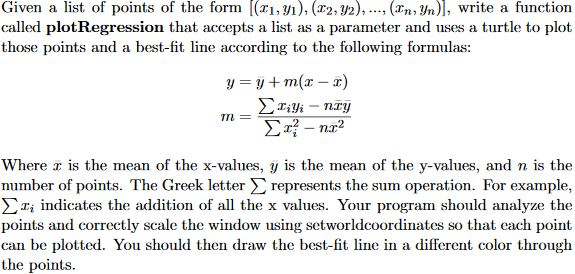
Given a list of points of the form [(xi, /i), (x2, 32), (^n, )), write a function called plotRegression that accepts a list as a parameter and uses a turtle to plot those points and a best-fit line according to the following formulas: Tn = Where z is the mean of the x-values, y is the mean of the y-values, and n is the number of points. The Greek letter represents the sum operation. For example, zi indicates the addition of all the x values. Your program should analyze the points and correctly scale the window using setworldcoordinates so that each point can be plotted. You should then draw the best-fit line in a different color through the points
Step by Step Solution
There are 3 Steps involved in it

Get step-by-step solutions from verified subject matter experts