

Question: Program in python 3.x. Please add comments in order to increase understanding of the solution. (If possible try to make the code as simple as
Program in python 3.x. Please add comments in order to increase understanding of the solution. (If possible try to make the code as simple as possible). Thanks. In case the question is too vague just create and display the mean and standard deviation to the histogram code
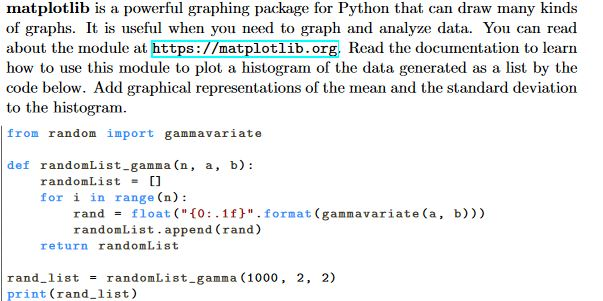
matplotlib is a powerful graphing package for Python that can draw many kinds of graphs. It is useful when you need to graph and analyze data. You can read about the module at https://matplotlib.org Read the documentation to learn how to use this module to plot a histogram of the data generated as a list by the code below. Add graphical representations of the mean and the standard deviation to the histogram. trom randon iaport gammavariate def randomList gamma(n, a, b) random1st = [] for i in range (n): rand = float ("(0: .1 "-format (gammavariate(a, randomList.append (rand) b))) return randomList rand-list randonList-gamma (1000, print (rand_list) 2, 2)
Step by Step Solution
There are 3 Steps involved in it

Get step-by-step solutions from verified subject matter experts