

Question: % Program P 3 _ 1 % Illustration of the Aliasing Effect % in the Frequency Domain clf; t = 0 : 0 . 0
Program P
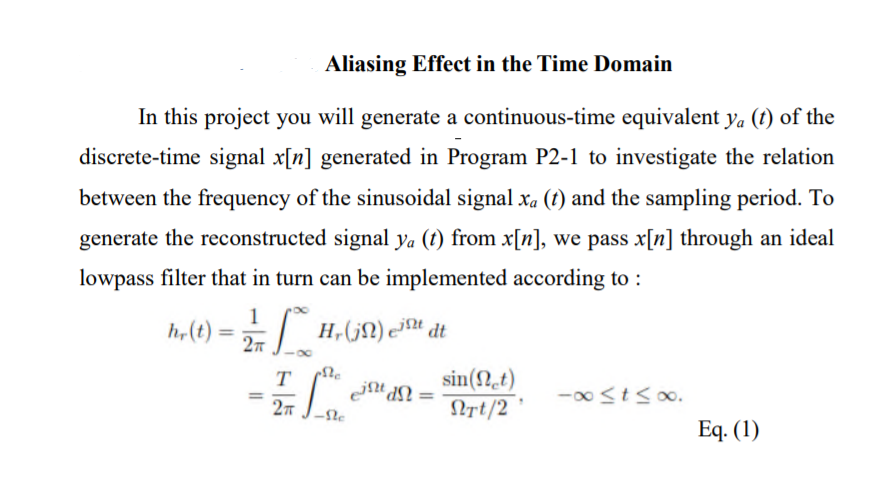
Illustration of the Aliasing Effect
in the Frequency Domain
clf;
t ::;
xa texpt;
subplot
plottxa;grid
xlabelTime msec;ylabelAmplitude;
titleContinuoustime signal xat;
subplot
wa ::;
ha freqswa;
plotwapiabsha;grid;
xlabelFrequency kHz;ylabelAmplitude;
titleXajOmega;
axispi ;
subplot
T;
n :T:;
xs nexpn;
k :lengthn;
stemkxs;grid;
xlabelTime index n;ylabelAmplitude;
titleDiscretetime signal xn;
subplot
wd :pi:pi;
hd freqzxswd;
plotwdTpi Tabshd;grid;
xlabelFrequency kHz;ylabelAmplitude;
titleXejomega;
axisT
Step by Step Solution
There are 3 Steps involved in it
1 Expert Approved Answer
Step: 1 Unlock

Question Has Been Solved by an Expert!
Get step-by-step solutions from verified subject matter experts
Step: 2 Unlock
Step: 3 Unlock