

Question: Programming Language is MATLAB. Q.9 You performed a test drive on an automobile where you alternately accelerate the automobile and then hold it at a
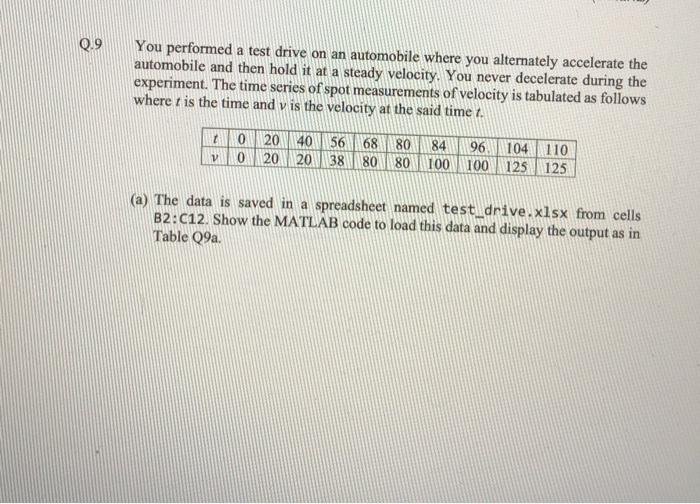
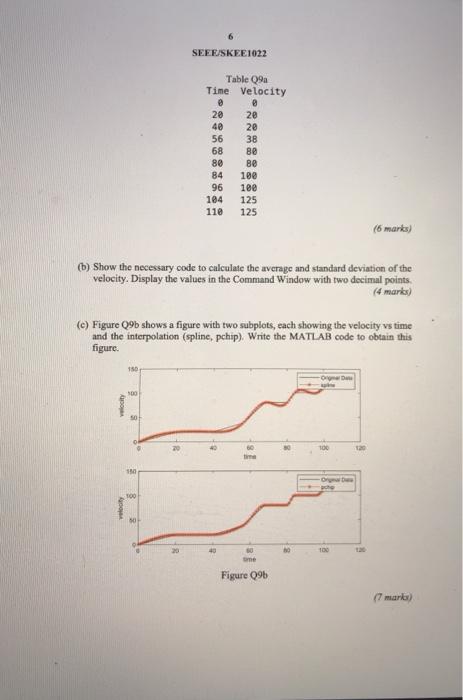
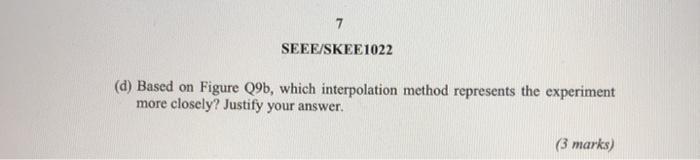
Q.9 You performed a test drive on an automobile where you alternately accelerate the automobile and then hold it at a steady velocity. You never decelerate during the experiment. The time series of spot measurements of velocity is tabulated as follows where t is the time and v is the velocity at the said time 1. 68 0 2014056 0 20 20 38 80 80 84 100 80 96 104 110 100 125 125 (a) The data is saved in a spreadsheet named test drive.xlsx from cells B2:012. Show the MATLAB code to load this data and display the output as in Table Q9a. SEEE SKEE1022 Table 09 Tine Velocity 20 40 56 68 80 84 96 184 110 28 20 38 80 Be 100 100 125 125 (6 marks) (b) Show the necessary code to calculate the average and standard deviation of the velocity. Display the values in the Command Window with two decimal points (4 marks) (c) Figure Q9b shows a figure with two subplots, each showing the velocity vs time and the interpolation (spline, pchip). Write the MATLAB code to obtain this figure. 150 100 ty 8 60 100 Tad -O 100 ty sme Figure 095 17 marts) 7 SEEE/SKEE 1022 (d) Based on Figure Q9b, which interpolation method represents the experiment more closely? Justify your
Step by Step Solution
There are 3 Steps involved in it

Get step-by-step solutions from verified subject matter experts