

Question: Project 1, Step 4: Instructions for This Excel Workbook View the balance sheet and income statement for the client company, Largo Global Inc. (LGI), using
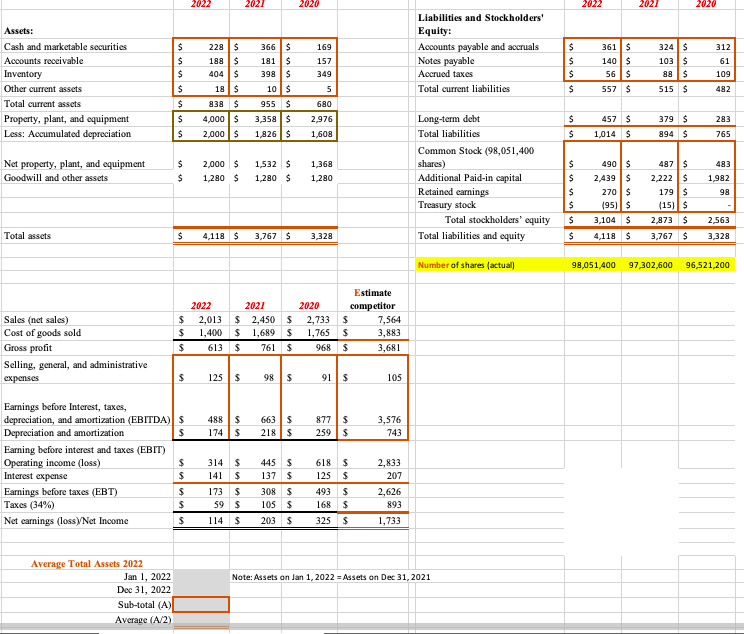
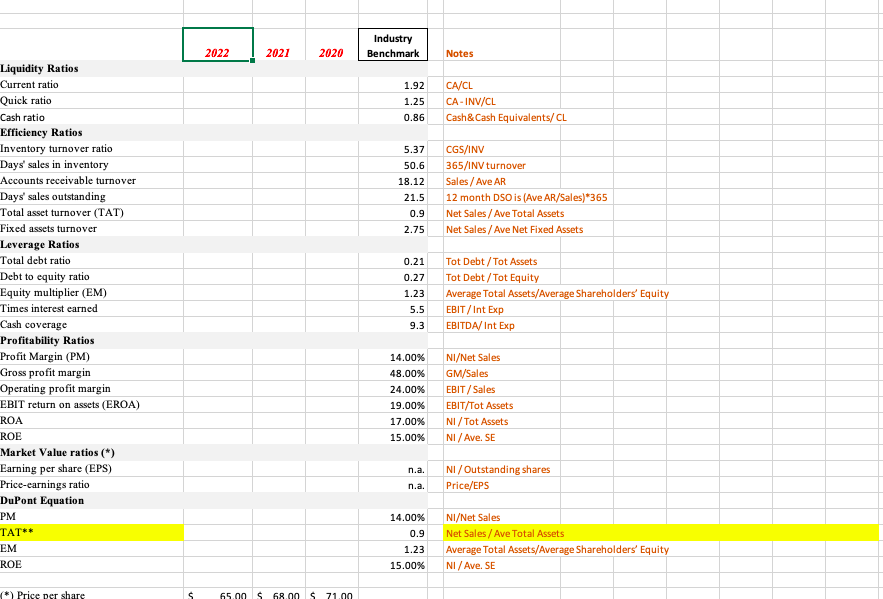
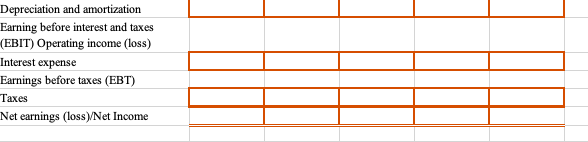
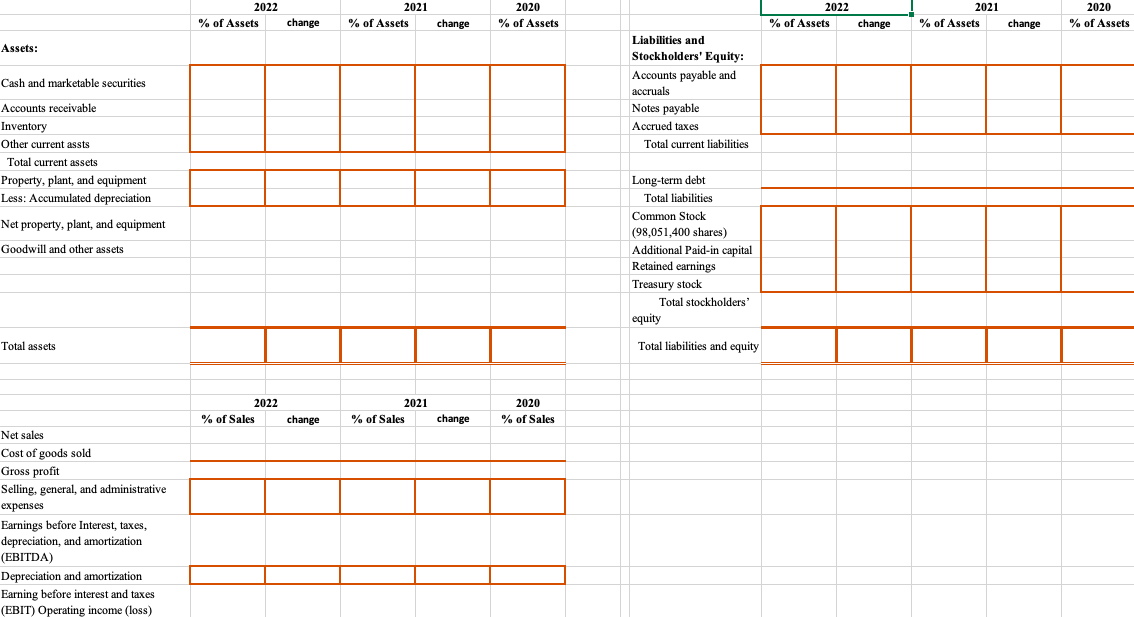
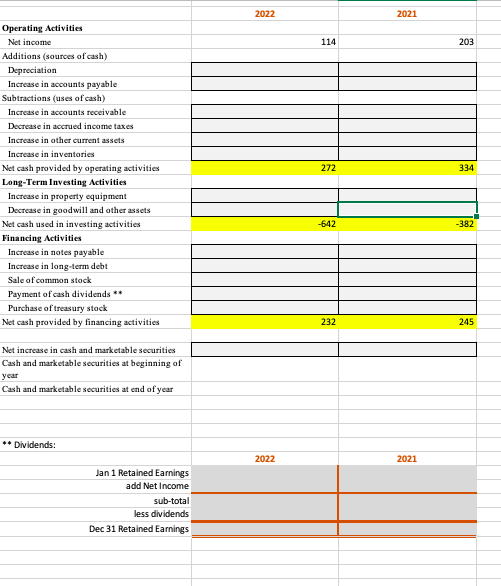
Project 1, Step 4: Instructions for This Excel Workbook View the balance sheet and income statement for the client company, Largo Global Inc. (LGI), using this Excel workbook, which includes the following tabs: 1. Bal. Sheet & Inc. Statement 2. Ratio Analysis 3. Common-size Analysis 4. Cash Flow Analysis You may submit this workbook as a milestone in Step 4, so you can receive feedback on the accuracy of your calculations before submitting your final project in Step 5 at the end of Week 2. Open tab 1. You see the balance sheet and income statement for LGI for 2020-22. You also see estimated average income statement data for LGI's main competitors. Use this information to complete the calculations in tabs 2-4. Perform your calculations using the formula bar in the Excel workbook. Open tab 2. You see six groups of financial ratios as well as an industry benchmark you can use for comparison with LGI's 2020-22 ratios. Calculate the ratios for each year. Open tab 3. Complete a common-size analysis. Open tab 4. Complete a cash flow analysis.2022 2021 2020 2022 2021 Liabilities and Stockholders' Assets: Equity: Cash and marketable securities 228 $ 366 169 Accounts payable and accruals 361 $ 324 $ 312 Accounts receivable 188 181 157 Notes payable 140 $ 103 61 Inventory 404 398 349 Accrued taxes 56 B8 109 Other current assets 10 Total current liabilities $ 557 $ 515 $ 482 Total current assets 838 $ 955 180 Property, plant, and equipment 4,000 3,358 $ 2,976 Long-term debt $ 457 379 $ 283 Less: Accumulated depreciation 2,000 $ 1,826 $ 1,608 Total liabilities 1 014 $ 394 $ 765 Common Stock (98,051,400 Net property, plant, and equipment 2,000 $ 1,532 $ 1,368 shares) 490 487 $ 483 Goodwill and other assets 1,280 $ 1 280 1 280 Additional Paid-in capital 2.439 2,222 1,98 Retained earnings 270 $ 179 Treasury stock 1951 (15) Total stockholders' equity 3,104 2,873 $ 2.563 Total assets $ 4,118 $ 3,767 $ 3,328 Total liabilities and equity 4,118 $ 3,767 3,328 Number of shares (actual) 98,051,400 97,302,600 96,521,200 Estimate 2022 2021 2020 competitor Sales (net sales) $ 2,013 $ 2,450 $ 2,733 $ 7,564 Cost of goods sold 1,400 $ 1,689 1,765 3,883 Gross profit 613 761 $ ,681 Selling, general, and administrative expenses 125 91 105 Earnings before Interest, taxes, depreciation, and amortization (EBITDA)| $ 48 8 6 63 877 3,576 Depreciation and amortization 174 $ 218 259 743 Earning before interest and taxes (EBIT) Operating income (loss) 314 445 $18 5 2,833 Interest expense 141 137 207 Earnings before taxes (EBT) $ 173 308 $ 493 $ 2,626 Taxes (34%) 59 $ 105 168 $ 893 Net carnings (loss)/Net Income 14 $ 203 325 | 1,733 Average Total Assets 2022 Jan 1, 2022 Note: Assets on Jan 1, 2022 = Assets on Dec 31, 2021 Dec 31, 2022 Sub-total (A) Average (A/2)Industry 2022 2021 2020 Benchmark Notes Liquidity Ratios Current ratio 1.92 CA/CL Quick ratio 1.25 CA- INV/CL Cash ratio D.86 Cash & Cash Equivalents/ CL Efficiency Ratios Inventory turnover ratio 5.37 CGS/INV Days' sales in inventory 50.6 365/INV turnover Accounts receivable turnover 18.12 Sales / Ave AR Days' sales outstanding 21.5 12 month DSO is (Ave AR/Sales)*365 Total asset turnover (TAT) 0.9 Net Sales / Ave Total Assets Fixed assets turnover 2.75 Net Sales / Ave Net Fixed Assets Leverage Ratios Total debt ratio 0.21 Tot Debt / Tot Assets Debt to equity ratio 0.27 Tot Debt / Tot Equity Equity multiplier (EM) 1.23 Average Total Assets/Average Shareholders' Equity Times interest earned 5.5 EBIT / Int Exp Cash coverage 9.3 EBITDA/ Int Exp Profitability Ratios Profit Margin (PM) 14.00% NI/Net Sales Gross profit margin 48.00% GM/Sales Operating profit margin 24.00% EBIT / Sales EBIT return on assets (EROA) 19.00% EBIT/Tot Assets ROA 17.00% NI / Tot Assets ROE 15.00% NI / Ave. SE Market Value ratios (*) Earning per share (EPS) n.a. NI / Outstanding shares Price-earnings ratio n.a Price/EPS DuPont Equation PM 14.00%% NI/Net Sales TAT* * 0.9 Net Sales / Ave Total Assets EM 1.23 Average Total Assets/Average Shareholders' Equity ROE 15.00% NI / Ave. SEDepreciation and amortization Earning before interest and taxes (EBIT) Operating income (loss) Interest expense Earnings before taxes (EBT) Taxes Net earnings (loss)/Net Income2022 2021 2020 2022 2021 2020 % of Assets change % of Assets change % of Assets % of Assets change % of Assets change % of Assets Liabilities and Assets: Stockholders' Equity: Accounts payable and Cash and marketable securities accruals Accounts receivable Notes payable Inventory Accrued taxes Other current assts Total current liabilities Total current assets Property, plant, and equipment Long-term debt Less: Accumulated depreciation Total liabilities Common Stock Net property, plant, and equipment (98,051,400 shares) Goodwill and other assets Additional Paid-in capital Retained earnings Treasury stock Total stockholders' equity Total assets Total liabilities and equity 2022 2021 2020 %% of Sales change of Sales change % of Sales Net sales Cost of goods sold Gross profit Selling, general, and administrative expenses Earnings before Interest, taxes, depreciation, and amortization (EBITDA) Depreciation and amortization Earning before interest and taxes EBIT) Operating income (loss)2022 2021 Operating Activities Net income 114 203 Additions (sources of cash) Depreciation Increase in accounts payable Subtractions (uses of cash) Increase in accounts receivable Decrease in accrued income taxes Increase in other current assets Increase in inventories Net cash provided by operating activities 272 Long-Term Investing Activities Increase in property equipment Decrease in good will and other assets Net cash used in investing activities 642 382 Financing Activities Increase in notes payable Increase in long-term debt Sale of common stock Payment of cash dividends * * Purchase of treasury stock Net cash provided by financing activities 232 245 Net increase in cash and marketable securities Cash and marketable securities at beginning of year Cash and marketable securities at end of year ** Dividends: 2022 2021 Jan 1 Retained Earnings add Net Income sub-total less dividends Dec 31 Retained Earnings
Step by Step Solution
There are 3 Steps involved in it

Get step-by-step solutions from verified subject matter experts