

Question: Project 2 Digital Image Processing CSCE 4240/5225 - Spring 2021 Distributed: Wednesday, January 27 Due: Thursday, February 11 [Solutions to this assignment must be submitted
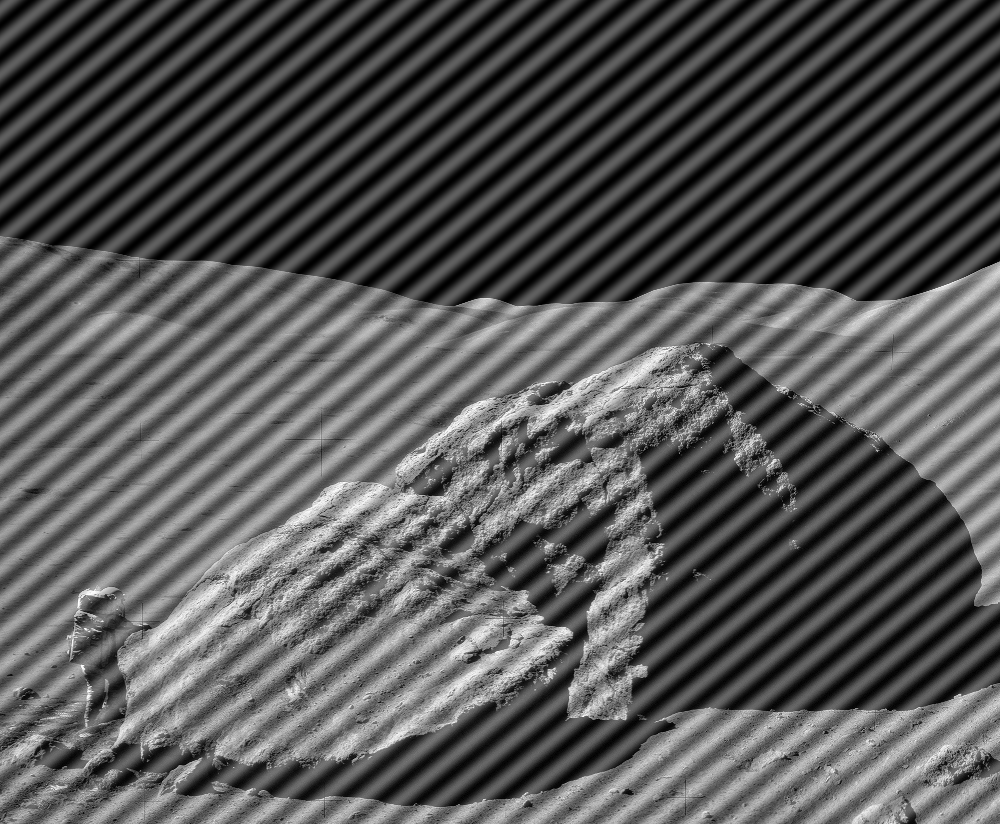
Project 2 Digital Image Processing CSCE 4240/5225 - Spring 2021 Distributed: Wednesday, January 27 Due: Thursday, February 11 [Solutions to this assignment must be submitted via CANVAS prior to midnight on the due date. Submissions no more than one day lote will not be penalized. Submissions up to one week late will be penalized 10 points. Submissions more than week lote and less than two weeks late will be penalized 20 points. Submissions will not be accepted after two weeks.] Purpose: Inculcate the mechanics of spatial resolution What to do: The total energy in an mn grayscale image, I, is the sum of the pixel values: 33765.9) Input a gray scale image (One is provided with the assignment on CANVAS.) Construct the following two images, collecting the energy statistics requested: IMAGE1 A gray scale image that is convolved with a 3x3 Gaussian filter 1000 times the output of iteration i should be the input to iteration i+1. Use an option that ignores border effects. Compute the total energy at the beginning and after every 100h iteration thereafter. Call this dataset of 11 values X. IMAGE2 Start with the same input grayscale image. Convolve with a 3x3 averaging filter 1000 times - the output of iteration i should be the input to iteration i+1. Use an option that ignores border effects. Compute the total energy at the beginning and after every 100th iteration thereafter. Call this dataset of 11 values Y. Hand in: (1) The code for the two convolution tasks, (2) iMAGE1, (3) IMAGE2, (4) a plot (line graph) of X and a plot of Y at the same scale, and (5) a report described below. Report: A report, approximately, % page in length, noting your observations and your hypotheses concerning the trajectories of X and Y. Conjecture on what the outcome would be if you had conducted 1,000,000 iterations. The report grade will be 10 points of the 100 points total for the assignment. Some hints to get started: For Matlab users, begin by studying filter2(
Step by Step Solution
There are 3 Steps involved in it

Get step-by-step solutions from verified subject matter experts