

Question: Project 2 : Historical Simulation Complete your work using the excel file H i s t S i m u l a t i
Project : Historical Simulation
Complete your work using the excel file roject
and submit via Project Dropbox.
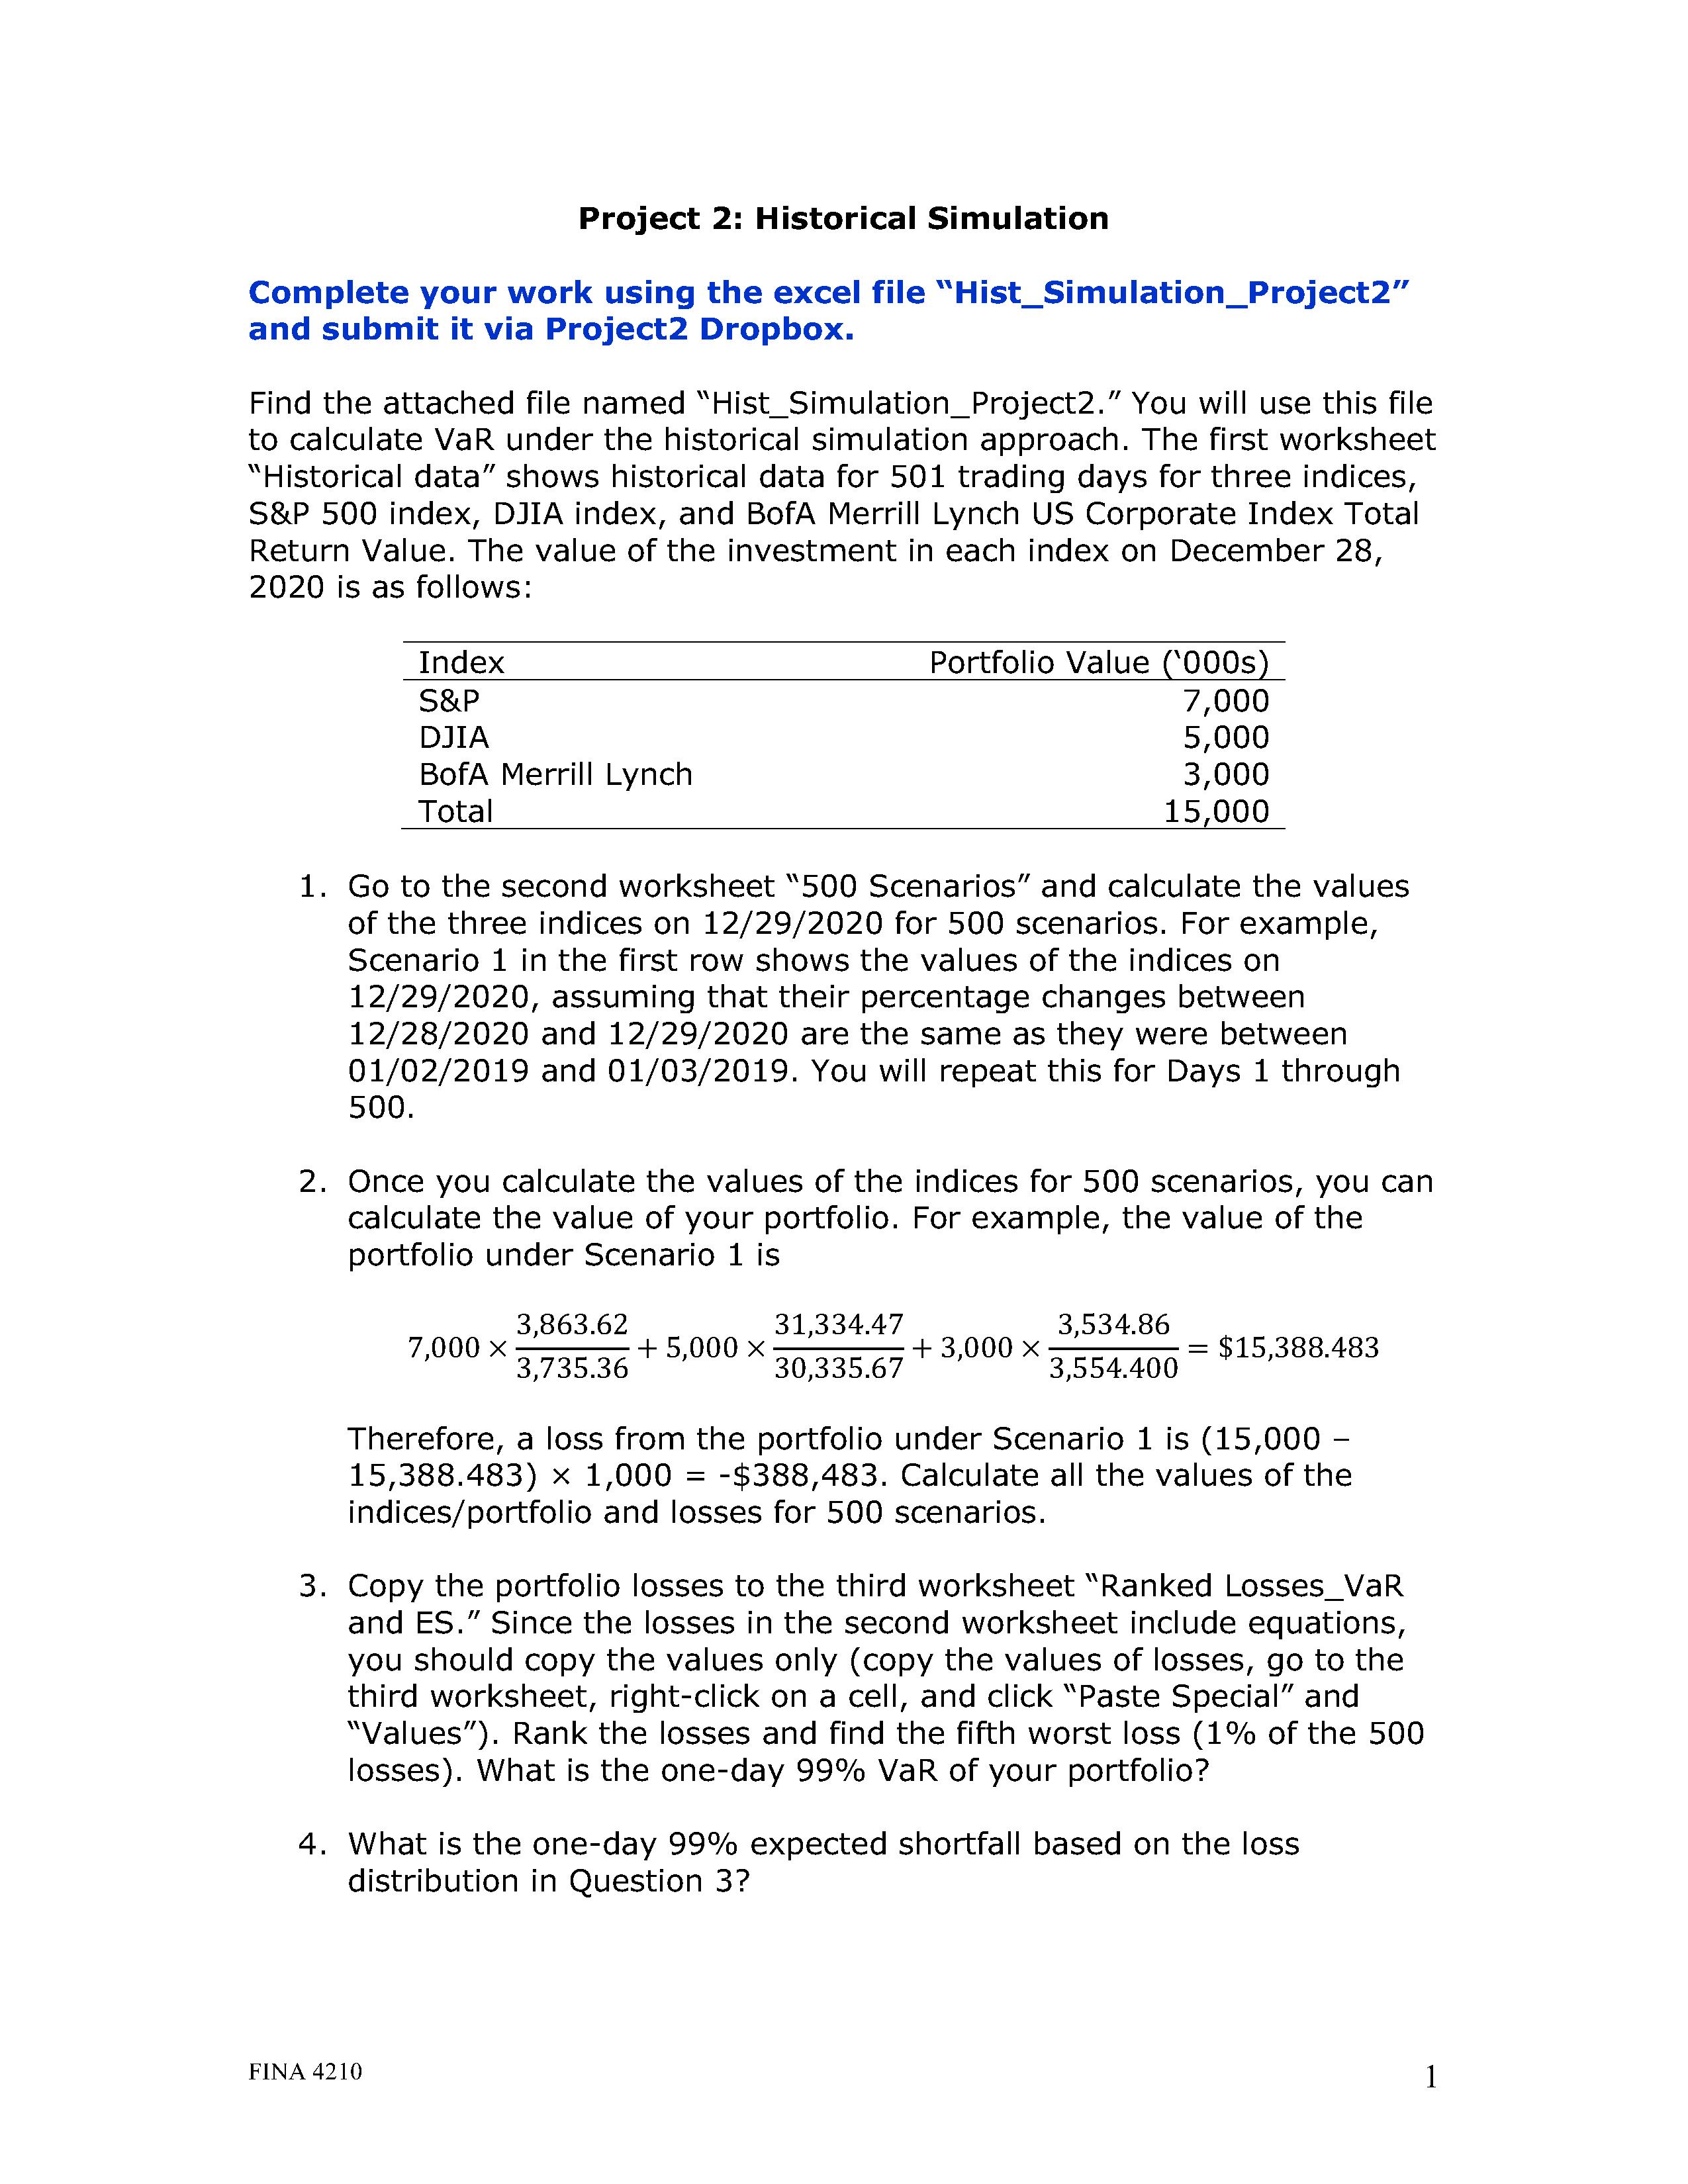
Find the attached file named roject You will use this file
calculate VaR under the historical simulation approach. The first worksheet
"Historical data" shows historical data for trading days for three indices,
& index, DJIA index, and BofA Merrill Corporate Index Total
Return Value. The value the investment each index December
follows:
the second worksheet Scenarios" and calculate the values
the three indices for scenarios. For example,
Scenario the first row shows the values the indices
assuming that their percentage changes between
and are the same they were between
and You will repeat this for Days through
Once you calculate the values the indices for scenarios, you can
calculate the value your portfolio. For example, the value the
portfolio under Scenario
$ the
losses VaR your portfolio?
What the oneday expected shortfall based the loss
distribution Question
Step by Step Solution
There are 3 Steps involved in it
1 Expert Approved Answer
Step: 1 Unlock

Question Has Been Solved by an Expert!
Get step-by-step solutions from verified subject matter experts
Step: 2 Unlock
Step: 3 Unlock