

Question: Project 5 Problem to solve Modify the code that was completed for Lab 1 8 Recall that in that program, two different subsizes were specified
Project Problem to solve
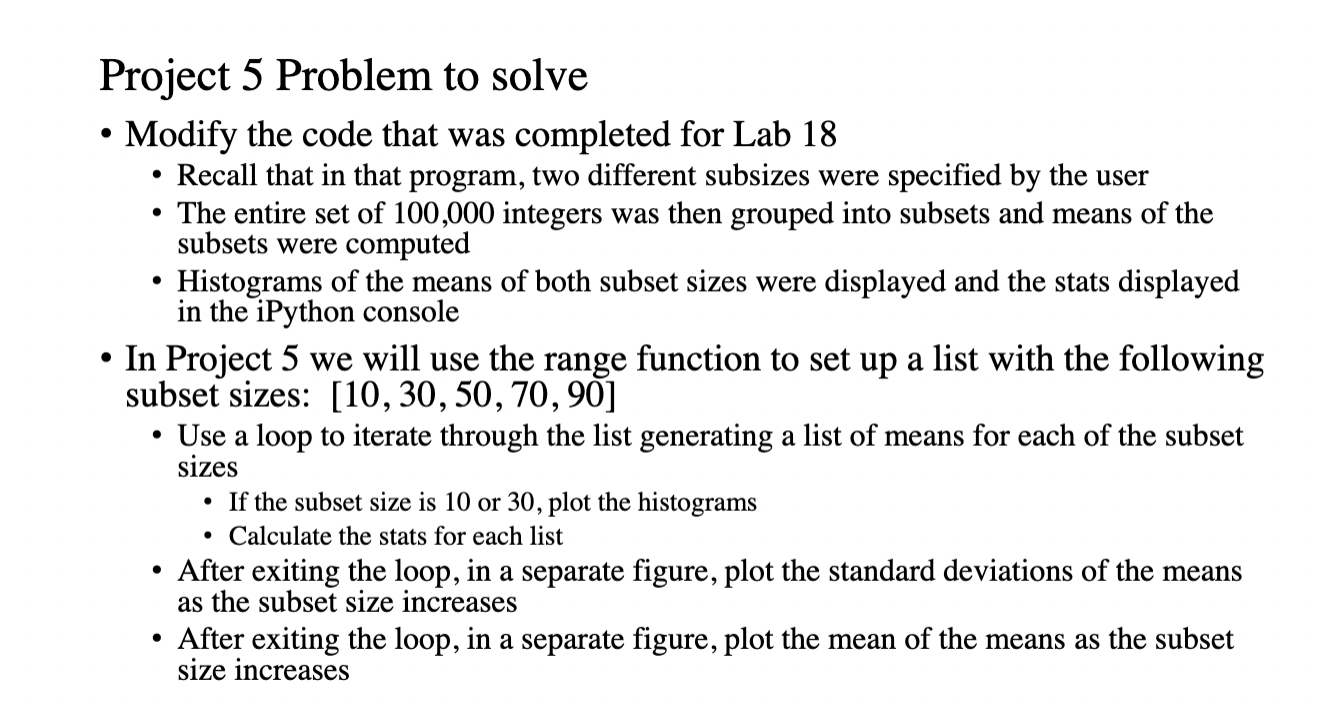
Modify the code that was completed for Lab
Recall that in that program, two different subsizes were specified by the user
The entire set of integers was then grouped into subsets and means of the
subsets were computed
Histograms of the means of both subset sizes were displayed and the stats displayed
in the iPython console
In Project we will use the range function to set up a list with the following
subset sizes:
Use a loop to iterate through the list generating a list of means for each of the subset
sizes
If the subset size is or plot the histograms
Calculate the stats for each list
After exiting the loop, in a separate figure, plot the standard deviations of the means
as the subset size increases
After exiting the loop, in a separate figure, plot the mean of the means as the subset
size increases How to solve Project :
The main difference between Lab and Project
Lab :
User input specified two subset sizes
Lists of means were generated with both subset sizes
Histograms displayed for both
Stats displayed for both
Project
The range function used to set up a list of subset sizes
We must use a loop to iterate through all elements in the list
For each element in the list we generate a list of means
For each list of means we calculate the following
Min of the mean
Max of the mean
Mean of the mean
Standard deviation of the mean
If subset size is or we plot histogram of the means in a single plot
After exiting the loop, we plot the standard deviations in a single plot and the means of the
means in a single plot How to solve Project continued:
You are free to solve this problem however you like, as long as you
fulfill the program requirements listed above in slide
However, if you would like assistance, here are some suggestions to
consider:
Write a function to plot the standard deviations
Write a function to plot the means of the means
Modify the plotHistograms function that was written in lab
Write a function to get all the lists
This is where we can loop to iterate through the subsetSizes list
It returns the list of means of the means and the list of standard deviations
of the means
These will be needed to make the plots
Possible pseudocode for this function is in the next few slides Project sample output
Stats displayed in the iPython console:Project sample output
Step by Step Solution
There are 3 Steps involved in it
1 Expert Approved Answer
Step: 1 Unlock

Question Has Been Solved by an Expert!
Get step-by-step solutions from verified subject matter experts
Step: 2 Unlock
Step: 3 Unlock