

Question: Project 8.1 Numerical and Analytical Methods with MATLAB Curve Fitting167 Projects Project 8.1 ribing the fuid level. 'hiy in a tank, as a function of
Project 8.1 Numerical and Analytical Methods with MATLAB
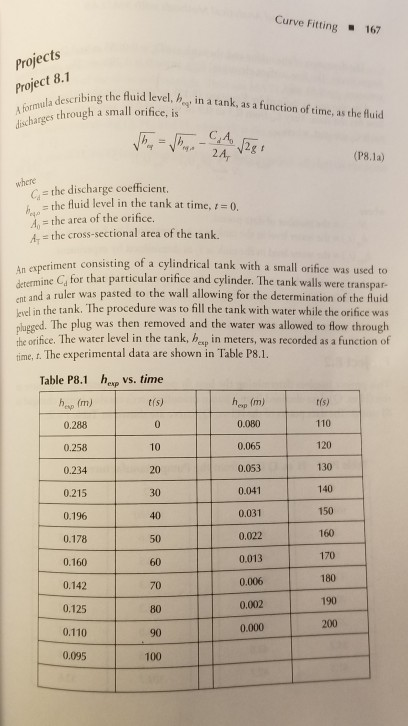
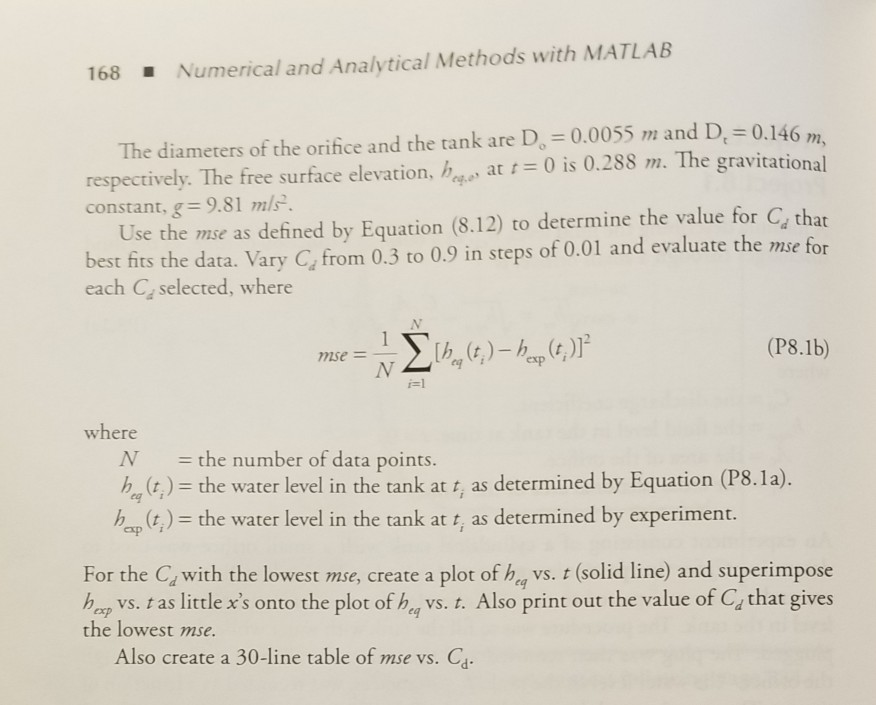
Curve Fitting167 Projects Project 8.1 ribing the fuid level. 'hiy in a tank, as a function of time, as the fluid harges through a small orifice, is (P8.1a) Gthe discharge coefficient a= the fluid level in the tank at time, 1:0. the area of the orifice. , 4 the cross-sectional area of the tank. n exneriment consisting of a cylindrical tank with a small orifice was used to articular orifice and cylinder. The tank walls were transpar- eat and a ruler was pasted to the wall allowing for the determination of the fHuid lkirl in the tank. The procedure was to fill the tank with water while the orifice was ouged. The plug was then removed and the water was allowed to flow through the orifice. The water level in the tank, hp in meters, was recorded as a function of term ime, t. The experimental data are shown in Table P8. hesp vs. time Table P8.1 hsp (m) 0.288 hexp (m) 0.080 0.065 0.053 0.041 0.031 0.022 0.013 0.006 0.002 0.000 tfs) 110 120 130 140 150 160 170 180 190 10 0.234 0.215 0.196 0.178 0.160 0.142 0.125 0.110 0.095 20 40 50 60 70 80 90 100 168 Numerical and Analytical Methods with MATLAB The diameters of the orifice and the tank are D 0.0055 m and D, 0.146 respectively. The free surface elevation, he', at t- 0 s 0.288 m. The gravitatio constant, g= 9.81 m/s rg.e Use the mse as defined by Equation (8.12) to determine the value for C, that best fits the data. Vary C, from 0.3 to 0.9 in steps of 0.01 and evaluate the mse for each C selected, where (P8.1b) where N the number of data points. h he water level in the tank at f, as determined by Equation (P8. 1a). hathe water level in the tank at t, as determined by experiment. For the Cwith the lowest mse, create a plot of h. vs. t (solid line) and superimpose h ap vs. t as little x's onto the plot of h., vs. t. Also print out the value of Ca that gives the lowest mse. Also create a 30-line table of mse vs. Cd
Step by Step Solution
There are 3 Steps involved in it

Get step-by-step solutions from verified subject matter experts