

Question: Project Analysis evaluation Generally, managers supplement the NPV analysis of a project through project analysis to get a better insight into the project. Project analysis
Project Analysis evaluation
Generally, managers supplement the NPV analysis of a project through project analysis to get a better insight into the project. Project analysis includes sensitivity analysis, break-even analysis, Monte Carlo simulation, and decision trees. The final decision should always rely on NPV analysis.
Make the necessary analysis above to show which option the business should invest in, according to the calculations below.
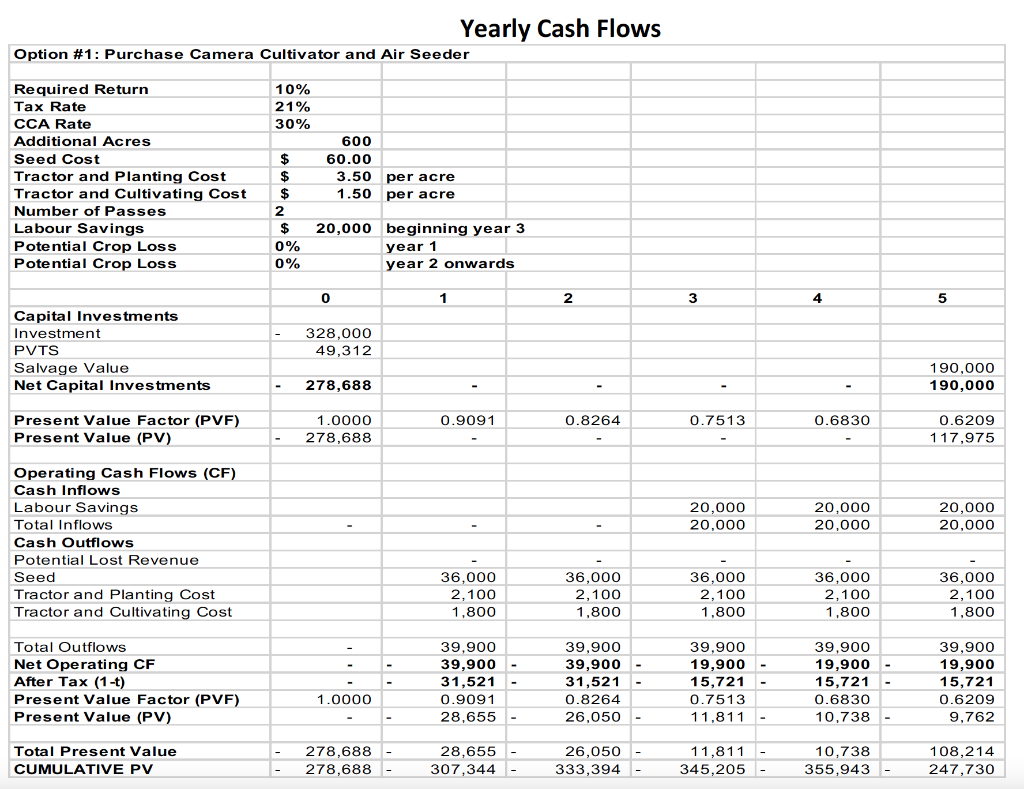
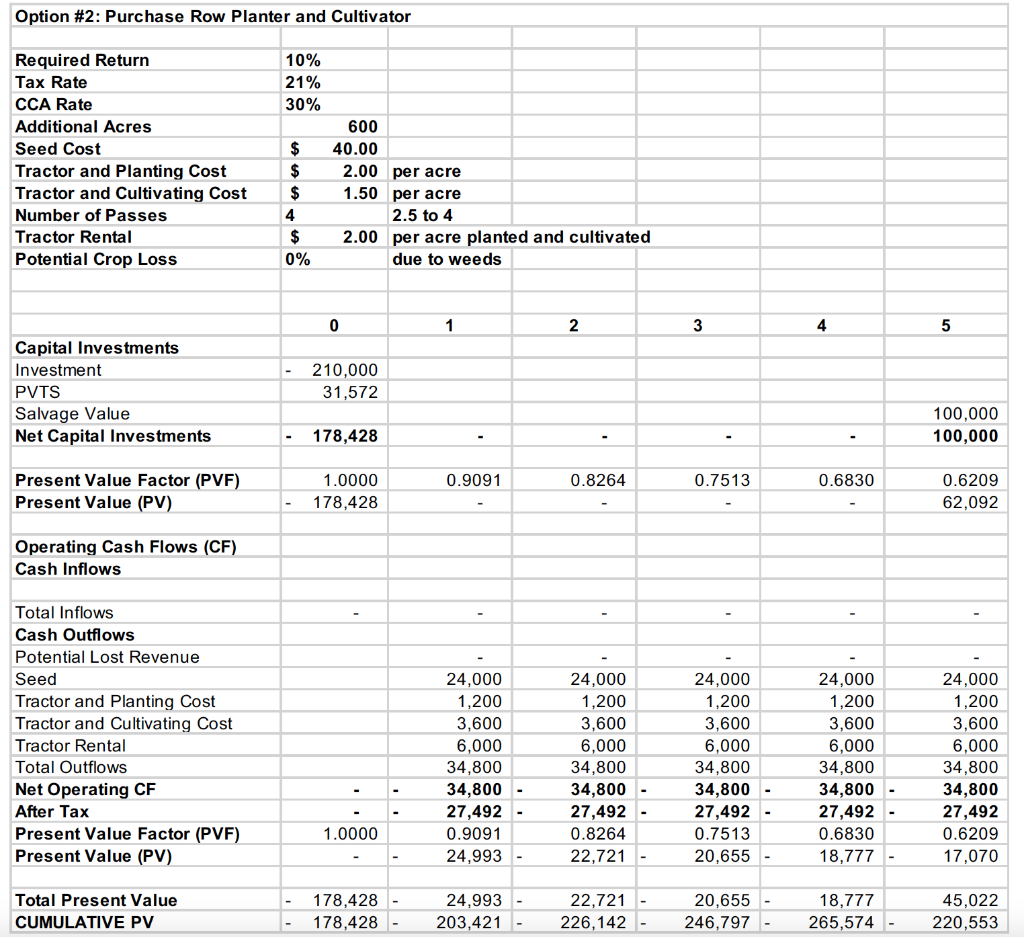
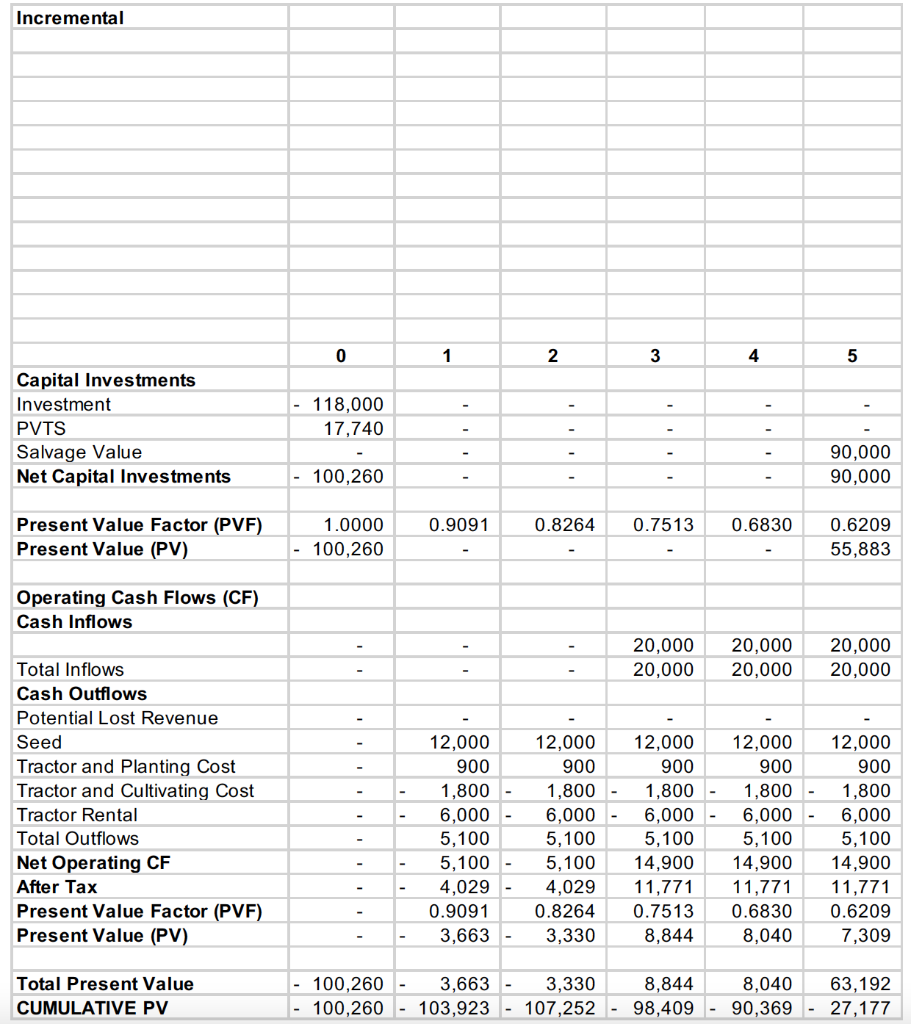
Yearly Cash Flows;
Sensitivity
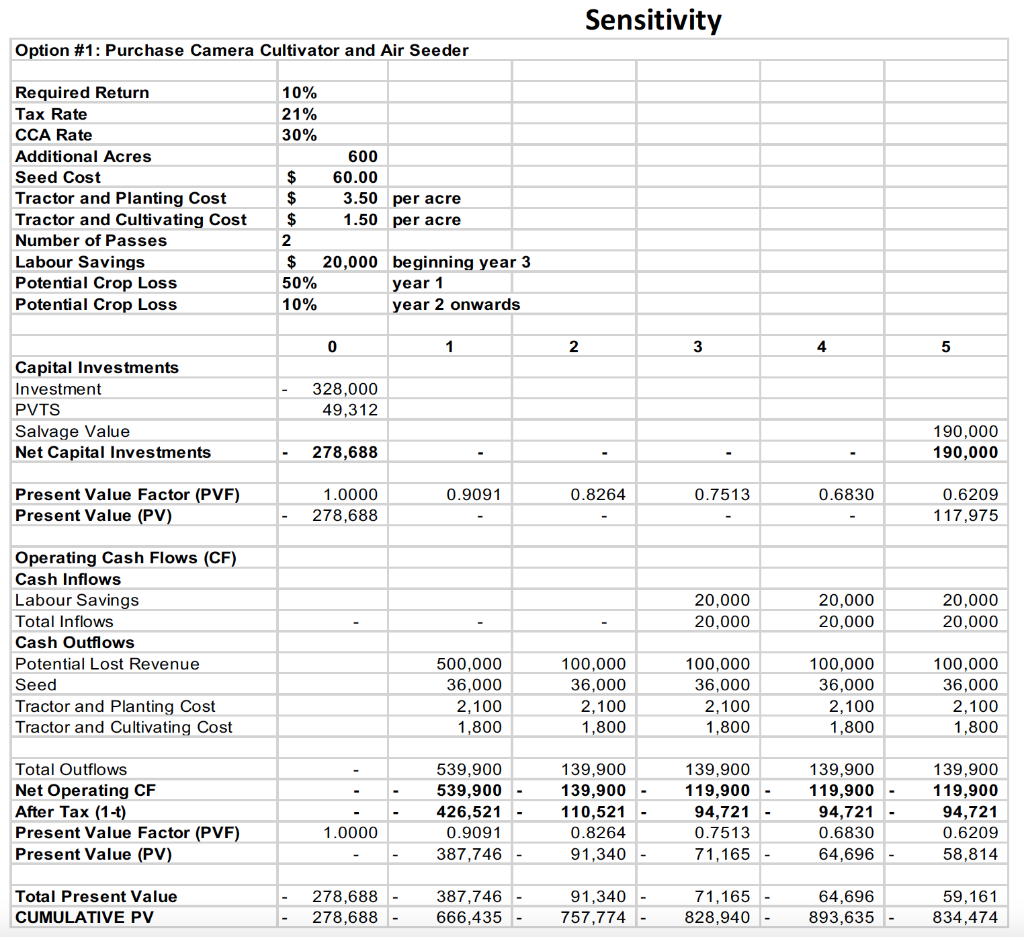
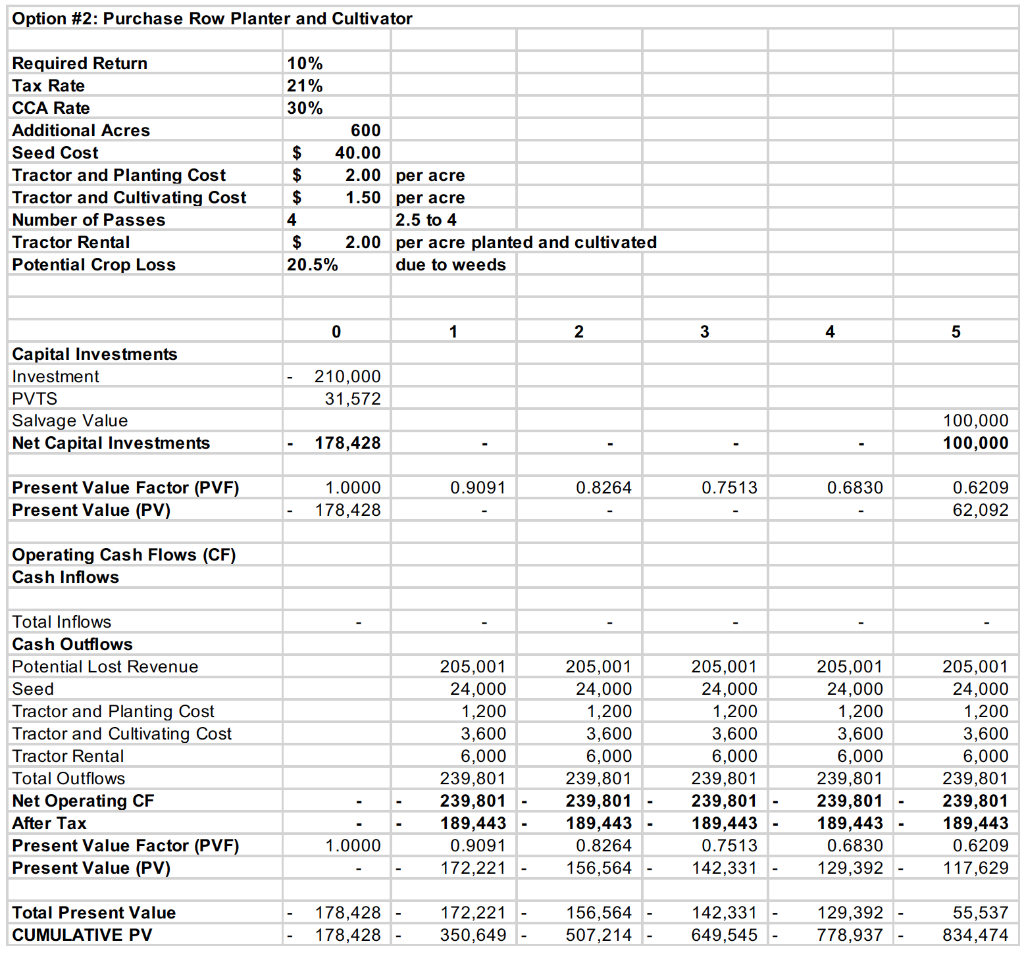
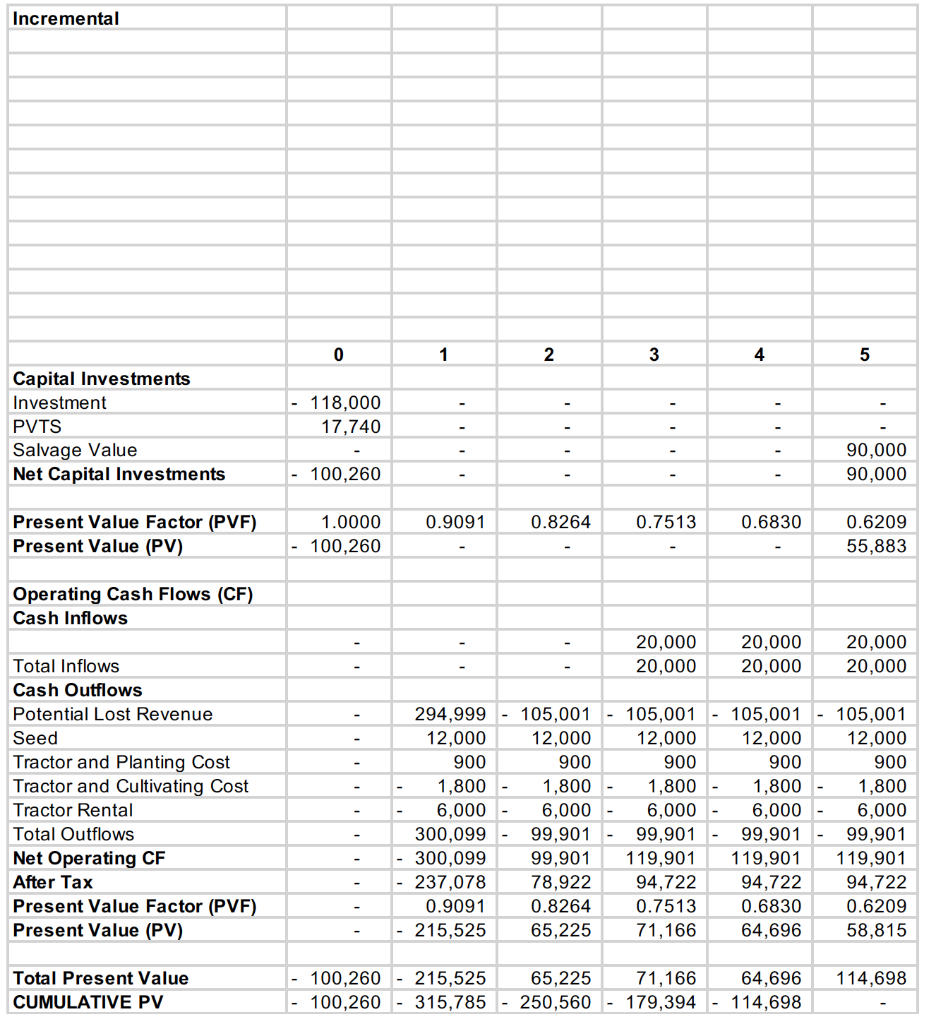
Yearly Cash Flows Option #1: Purchase Camera Cultivator and Air Seeder 10% 21% 30% Required Return Tax Rate CCA Rate Additional Acres Seed Cost Tractor and Planting Cost Tractor and Cultivating Cost Number of Passes Labour Savings Potential Crop Loss Potential Crop Loss 600 60.00 3.50 1.50 per acre per acre $ $ $ 2 $ 0% 0% 20,000 beginning year 3 year 1 year 2 onwards 0 1 2 3 4 5 Capital Investments Investment PVTS Salvage Value Net Capital Investments 328,000 49,312 190,000 190,000 278,688 0.9091 0.8264 0.7513 0.6830 Present Value Factor (PVF) Present Value (PV) 1.0000 278,688 0.6209 117,975 20,000 20,000 20,000 20,000 20,000 20,000 Operating Cash Flows (CF) Cash Inflows Labour Savings Total Inflows Cash Outflows Potential Lost Revenue Seed Tractor and Planting Cost Tractor and Cultivating Cost 36,000 2,100 1,800 36,000 2,100 1.800 36,000 2,100 1,800 36,000 2,100 1,800 36,000 2,100 1,800 Total Outflows Net Operating CF After Tax (1-t) Present Value Factor (PVF) Present Value (PV) 39,900 39,900 31,521 0.9091 28,655 39,900 39,900 31,521 0.8264 26,050 39,900 19,900 15,721 0.7513 11,811 39,900 19,900 15,721 0.6830 10.738 39,900 19,900 15,721 0.6209 9,762 1.0000 Total Present Value CUMULATIVE PV 278,688 278,688 28.655 307,344 26,050 333,394 11,811 345,205 10,738 355,943 108,214 247,730 Option #2: Purchase Row Planter and Cultivator 10% 21% 30% Required Return Tax Rate CCA Rate Additional Acres Seed Cost Tractor and Planting Cost Tractor and Cultivating Cost Number of Passes Tractor Rental Potential Crop Loss $ $ $ 4 $ 0% 600 40.00 2.00 per acre 1.50 per acre 2.5 to 4 2.00 per acre planted and cultivated due to weeds 0 1 2 3 4 5 Capital Investments Investment PVTS Salvage Value Net Capital Investments 210,000 31,572 100,000 100,000 178,428 0.9091 0.8264 0.7513 0.6830 Present Value Factor (PVF) Present Value (PV) 1.0000 178,428 0.6209 62,092 Operating Cash Flows (CF) Cash Inflows Total Inflows Cash Outflows Potential Lost Revenue Seed Tractor and Planting Cost Tractor and Cultivating Cost Tractor Rental Total Outflows Net Operating CF After Tax Present Value Factor (PVF) Present Value (PV) 24,000 1,200 3,600 6,000 34,800 34,800 27,492 0.9091 24,993 24,000 1,200 3,600 6,000 34,800 34,800 27,492 0.8264 22,721 24,000 1,200 3,600 6,000 34,800 34,800 27,492 0.7513 20,655 24,000 1,200 3,600 6,000 34,800 34,800 27,492 0.6830 18,777 24,000 1,200 3,600 6,000 34,800 34,800 27,492 0.6209 17,070 1.0000 Total Present Value CUMULATIVE PV 178,428 178,428 24,993 203,421 22,721 - 226,142 - 20,655 246,797 18,777 265,574 - 45,022 220,553 Incremental 0 1 2 3 4 5 Capital Investments Investment PVTS Salvage Value Net Capital Investments 118,000 17,740 I' 90,000 90,000 100,260 0.9091 0.8264 0.7513 0.6830 Present Value Factor (PVF) Present Value (PV) 1.0000 100,260 0.6209 55,883 Operating Cash Flows (CF) Cash Inflows 20,000 20,000 20,000 20,000 20,000 20,000 Total Inflows Cash Outflows Potential Lost Revenue Seed Tractor and Planting Cost Tractor and Cultivating Cost Tractor Rental Total Outflows Net Operating CF After Tax Present Value Factor (PVF) Present Value (PV) 12,000 900 1,800 6,000 5,100 5,100 4,029 0.9091 3,663 12,000 900 1,800 6,000 5,100 5,100 4,029 0.8264 3,330 12,000 900 1,800 6,000 - 5,100 14,900 11,771 0.7513 8,844 12,000 900 1,800 6,000 5,100 14,900 11,771 0.6830 8,040 12,000 900 1,800 6,000 5,100 14,900 11,771 0.6209 7,309 Total Present Value CUMULATIVE PV 100,260 3,663 3,330 8,844 100,260 - 103,923 - 107,252 - 98,409 8,040 90,369 63,192 27,177 Sensitivity Option #1: Purchase Camera Cultivator and Air Seeder Required Return Tax Rate CCA Rate Additional Acres Seed Cost Tractor and Planting Cost Tractor and Cultivating Cost Number of Passes Labour Savings Potential Crop Loss Potential Crop Loss 10% 21% 30% 600 $ 60.00 $ 3.50 per acre $ 1.50 per acre 2 $ 20,000 beginning year 3 50% year 1 10% year 2 onwards 0 1 2 3 4 5 Capital Investments Investment PVTS Salvage Value Net Capital Investments 328,000 49,312 190,000 190,000 278,688 0.9091 0.8264 0.7513 0.6830 Present Value Factor (PVF) Present Value (PV) 1.0000 278,688 0.6209 117,975 20,000 20,000 20,000 20,000 20.000 20,000 Operating Cash Flows (CF) Cash Inflows Labour Savings Total Inflows Cash Outflows Potential Lost Revenue Seed Tractor and Planting Cost Tractor and Cultivating Cost 500,000 36,000 2,100 1,800 100,000 36,000 2,100 1,800 100,000 36,000 2,100 1,800 100,000 36,000 2,100 1,800 100,000 36,000 2.100 1.800 Total Outflows Net Operating CF After Tax (1-t) Present Value Factor (PVF) Present Value (PV) 539,900 539,900 426,521 0.9091 387,746 139,900 139,900 - 110,521 0.8264 91,340 - 139,900 119,900 94,721 0.7513 71,165 - 139,900 119,900 94,721 0.6830 64,696 139,900 119,900 94,721 0.6209 58,814 1.0000 Total Present Value CUMULATIVE PV 278,688 278,688 387,746 666,435 91,340 757,774 - 71,165 828,940 64,696 893,635 59,161 834,474 Option #2: Purchase Row Planter and Cultivator Required Return Tax Rate CCA Rate Additional Acres Seed Cost Tractor and Planting Cost Tractor and Cultivating Cost Number of Passes Tractor Rental Potential Crop Loss 10% 21% 30% 600 $ 40.00 $ 2.00 per acre $ 1.50 per acre 4 2.5 to 4 $ 2.00 per acre planted and cultivated 20.5% due to weeds 0 1 2 4 5 Capital Investments Investment PVTS Salvage Value Net Capital Investments 210,000 31,572 100,000 100,000 178,428 0.9091 0.8264 0.7513 0.6830 Present Value Factor (PVF) Present Value (PV) 1.0000 178,428 0.6209 62,092 Operating Cash Flows (CF) Cash Inflows Total Inflows Cash Outflows Potential Lost Revenue Seed Tractor and Planting Cost Tractor and Cultivating Cost Tractor Rental Total Outflows Net Operating CF After Tax Present Value Factor (PVF) Present Value (PV) 205,001 24.000 1,200 3,600 6,000 239,801 239,801 189,443 0.9091 172,221 - 205,001 24,000 1,200 3,600 6,000 239,801 239,801 - 189,443 0.8264 156,564 205,001 24,000 1,200 3,600 6,000 239,801 239,801 - 189,443 0.7513 142,331 205,001 24,000 1,200 3,600 6,000 239,801 239,801 - 189,443 0.6830 129,392 205,001 24,000 1,200 3,600 6,000 239,801 239,801 189,443 0.6209 117,629 1.0000 Total Present Value CUMULATIVE PV 178,428 - 178,428 172,221 350,649 156,564 507,214 142,331 649,545 129,392 778,937 55,537 834,474 Incremental 0 1 N 3 4 5 Capital Investments Investment PVTS Salvage Value Net Capital Investments - 118,000 17,740 90,000 90,000 100,260 0.9091 0.8264 0.7513 0.6830 Present Value Factor (PVF) Present Value (PV) 1.0000 100,260 0.6209 55,883 Operating Cash Flows (CF) Cash Inflows 20,000 20,000 20,000 20,000 20,000 20,000 Total Inflows Cash Outflows Potential Lost Revenue Seed Tractor and Planting Cost Tractor and Cultivating Cost Tractor Rental Total Outflows Net Operating CF After Tax Present Value Factor (PVF) Present Value (PV) 294,999 12,000 900 1,800 6,000 300,099 300,099 237,078 0.9091 - 215,525 105,001 - 105,001 - 105,001 12,000 12,000 12,000 900 900 900 1,800 1,800 1,800 6,000 6,000 6,000 99,901 99,901 99,901 99,901 119,901 119,901 78,922 94,722 94,722 0.8264 0.7513 0.6830 65,225 71,166 64,696 105,001 12,000 900 1,800 6,000 99,901 119,901 94,722 0.6209 58,815 114,698 Total Present Value CUMULATIVE PV 100,260 - 215,525 - 100,260 - 315,785 65,225 250,560 71,166 64,696 179,394 - 114,698 Yearly Cash Flows Option #1: Purchase Camera Cultivator and Air Seeder 10% 21% 30% Required Return Tax Rate CCA Rate Additional Acres Seed Cost Tractor and Planting Cost Tractor and Cultivating Cost Number of Passes Labour Savings Potential Crop Loss Potential Crop Loss 600 60.00 3.50 1.50 per acre per acre $ $ $ 2 $ 0% 0% 20,000 beginning year 3 year 1 year 2 onwards 0 1 2 3 4 5 Capital Investments Investment PVTS Salvage Value Net Capital Investments 328,000 49,312 190,000 190,000 278,688 0.9091 0.8264 0.7513 0.6830 Present Value Factor (PVF) Present Value (PV) 1.0000 278,688 0.6209 117,975 20,000 20,000 20,000 20,000 20,000 20,000 Operating Cash Flows (CF) Cash Inflows Labour Savings Total Inflows Cash Outflows Potential Lost Revenue Seed Tractor and Planting Cost Tractor and Cultivating Cost 36,000 2,100 1,800 36,000 2,100 1.800 36,000 2,100 1,800 36,000 2,100 1,800 36,000 2,100 1,800 Total Outflows Net Operating CF After Tax (1-t) Present Value Factor (PVF) Present Value (PV) 39,900 39,900 31,521 0.9091 28,655 39,900 39,900 31,521 0.8264 26,050 39,900 19,900 15,721 0.7513 11,811 39,900 19,900 15,721 0.6830 10.738 39,900 19,900 15,721 0.6209 9,762 1.0000 Total Present Value CUMULATIVE PV 278,688 278,688 28.655 307,344 26,050 333,394 11,811 345,205 10,738 355,943 108,214 247,730 Option #2: Purchase Row Planter and Cultivator 10% 21% 30% Required Return Tax Rate CCA Rate Additional Acres Seed Cost Tractor and Planting Cost Tractor and Cultivating Cost Number of Passes Tractor Rental Potential Crop Loss $ $ $ 4 $ 0% 600 40.00 2.00 per acre 1.50 per acre 2.5 to 4 2.00 per acre planted and cultivated due to weeds 0 1 2 3 4 5 Capital Investments Investment PVTS Salvage Value Net Capital Investments 210,000 31,572 100,000 100,000 178,428 0.9091 0.8264 0.7513 0.6830 Present Value Factor (PVF) Present Value (PV) 1.0000 178,428 0.6209 62,092 Operating Cash Flows (CF) Cash Inflows Total Inflows Cash Outflows Potential Lost Revenue Seed Tractor and Planting Cost Tractor and Cultivating Cost Tractor Rental Total Outflows Net Operating CF After Tax Present Value Factor (PVF) Present Value (PV) 24,000 1,200 3,600 6,000 34,800 34,800 27,492 0.9091 24,993 24,000 1,200 3,600 6,000 34,800 34,800 27,492 0.8264 22,721 24,000 1,200 3,600 6,000 34,800 34,800 27,492 0.7513 20,655 24,000 1,200 3,600 6,000 34,800 34,800 27,492 0.6830 18,777 24,000 1,200 3,600 6,000 34,800 34,800 27,492 0.6209 17,070 1.0000 Total Present Value CUMULATIVE PV 178,428 178,428 24,993 203,421 22,721 - 226,142 - 20,655 246,797 18,777 265,574 - 45,022 220,553 Incremental 0 1 2 3 4 5 Capital Investments Investment PVTS Salvage Value Net Capital Investments 118,000 17,740 I' 90,000 90,000 100,260 0.9091 0.8264 0.7513 0.6830 Present Value Factor (PVF) Present Value (PV) 1.0000 100,260 0.6209 55,883 Operating Cash Flows (CF) Cash Inflows 20,000 20,000 20,000 20,000 20,000 20,000 Total Inflows Cash Outflows Potential Lost Revenue Seed Tractor and Planting Cost Tractor and Cultivating Cost Tractor Rental Total Outflows Net Operating CF After Tax Present Value Factor (PVF) Present Value (PV) 12,000 900 1,800 6,000 5,100 5,100 4,029 0.9091 3,663 12,000 900 1,800 6,000 5,100 5,100 4,029 0.8264 3,330 12,000 900 1,800 6,000 - 5,100 14,900 11,771 0.7513 8,844 12,000 900 1,800 6,000 5,100 14,900 11,771 0.6830 8,040 12,000 900 1,800 6,000 5,100 14,900 11,771 0.6209 7,309 Total Present Value CUMULATIVE PV 100,260 3,663 3,330 8,844 100,260 - 103,923 - 107,252 - 98,409 8,040 90,369 63,192 27,177 Sensitivity Option #1: Purchase Camera Cultivator and Air Seeder Required Return Tax Rate CCA Rate Additional Acres Seed Cost Tractor and Planting Cost Tractor and Cultivating Cost Number of Passes Labour Savings Potential Crop Loss Potential Crop Loss 10% 21% 30% 600 $ 60.00 $ 3.50 per acre $ 1.50 per acre 2 $ 20,000 beginning year 3 50% year 1 10% year 2 onwards 0 1 2 3 4 5 Capital Investments Investment PVTS Salvage Value Net Capital Investments 328,000 49,312 190,000 190,000 278,688 0.9091 0.8264 0.7513 0.6830 Present Value Factor (PVF) Present Value (PV) 1.0000 278,688 0.6209 117,975 20,000 20,000 20,000 20,000 20.000 20,000 Operating Cash Flows (CF) Cash Inflows Labour Savings Total Inflows Cash Outflows Potential Lost Revenue Seed Tractor and Planting Cost Tractor and Cultivating Cost 500,000 36,000 2,100 1,800 100,000 36,000 2,100 1,800 100,000 36,000 2,100 1,800 100,000 36,000 2,100 1,800 100,000 36,000 2.100 1.800 Total Outflows Net Operating CF After Tax (1-t) Present Value Factor (PVF) Present Value (PV) 539,900 539,900 426,521 0.9091 387,746 139,900 139,900 - 110,521 0.8264 91,340 - 139,900 119,900 94,721 0.7513 71,165 - 139,900 119,900 94,721 0.6830 64,696 139,900 119,900 94,721 0.6209 58,814 1.0000 Total Present Value CUMULATIVE PV 278,688 278,688 387,746 666,435 91,340 757,774 - 71,165 828,940 64,696 893,635 59,161 834,474 Option #2: Purchase Row Planter and Cultivator Required Return Tax Rate CCA Rate Additional Acres Seed Cost Tractor and Planting Cost Tractor and Cultivating Cost Number of Passes Tractor Rental Potential Crop Loss 10% 21% 30% 600 $ 40.00 $ 2.00 per acre $ 1.50 per acre 4 2.5 to 4 $ 2.00 per acre planted and cultivated 20.5% due to weeds 0 1 2 4 5 Capital Investments Investment PVTS Salvage Value Net Capital Investments 210,000 31,572 100,000 100,000 178,428 0.9091 0.8264 0.7513 0.6830 Present Value Factor (PVF) Present Value (PV) 1.0000 178,428 0.6209 62,092 Operating Cash Flows (CF) Cash Inflows Total Inflows Cash Outflows Potential Lost Revenue Seed Tractor and Planting Cost Tractor and Cultivating Cost Tractor Rental Total Outflows Net Operating CF After Tax Present Value Factor (PVF) Present Value (PV) 205,001 24.000 1,200 3,600 6,000 239,801 239,801 189,443 0.9091 172,221 - 205,001 24,000 1,200 3,600 6,000 239,801 239,801 - 189,443 0.8264 156,564 205,001 24,000 1,200 3,600 6,000 239,801 239,801 - 189,443 0.7513 142,331 205,001 24,000 1,200 3,600 6,000 239,801 239,801 - 189,443 0.6830 129,392 205,001 24,000 1,200 3,600 6,000 239,801 239,801 189,443 0.6209 117,629 1.0000 Total Present Value CUMULATIVE PV 178,428 - 178,428 172,221 350,649 156,564 507,214 142,331 649,545 129,392 778,937 55,537 834,474 Incremental 0 1 N 3 4 5 Capital Investments Investment PVTS Salvage Value Net Capital Investments - 118,000 17,740 90,000 90,000 100,260 0.9091 0.8264 0.7513 0.6830 Present Value Factor (PVF) Present Value (PV) 1.0000 100,260 0.6209 55,883 Operating Cash Flows (CF) Cash Inflows 20,000 20,000 20,000 20,000 20,000 20,000 Total Inflows Cash Outflows Potential Lost Revenue Seed Tractor and Planting Cost Tractor and Cultivating Cost Tractor Rental Total Outflows Net Operating CF After Tax Present Value Factor (PVF) Present Value (PV) 294,999 12,000 900 1,800 6,000 300,099 300,099 237,078 0.9091 - 215,525 105,001 - 105,001 - 105,001 12,000 12,000 12,000 900 900 900 1,800 1,800 1,800 6,000 6,000 6,000 99,901 99,901 99,901 99,901 119,901 119,901 78,922 94,722 94,722 0.8264 0.7513 0.6830 65,225 71,166 64,696 105,001 12,000 900 1,800 6,000 99,901 119,901 94,722 0.6209 58,815 114,698 Total Present Value CUMULATIVE PV 100,260 - 215,525 - 100,260 - 315,785 65,225 250,560 71,166 64,696 179,394 - 114,698
Step by Step Solution
There are 3 Steps involved in it

Get step-by-step solutions from verified subject matter experts