

Question: Project: Analyzing Stock Data Due date: Sunday, April 2 8 th Spring 2 0 2 4 1 Introduction In this project, you will explore the
Project: Analyzing Stock Data Due date: Sunday, April th
Spring
Introduction
In this project, you will explore the intersection of finance and data structures, applying your programming skills to analyze stock market data. This project is designed to give you practical experience with data structures by manipulating, analyzing, and deriving insights from realworld financial data.
The Dataset
The dataset you will be working with contains historical stock data for various companies. This data includes the open, high, low, close prices, and volume of trades for each trading day:
Date: The specific trading day for which the data is recorded.
Open: The price at which the first trade was made at the beginning of the trading day.
High: The highest price that the stock reached during the trading day.
Low: The lowest price that the stock reached during the trading day.
Close: The price at which the last trade was made at the end of the trading day.
Volume: The number of shares of the stock that were traded during the trading day.
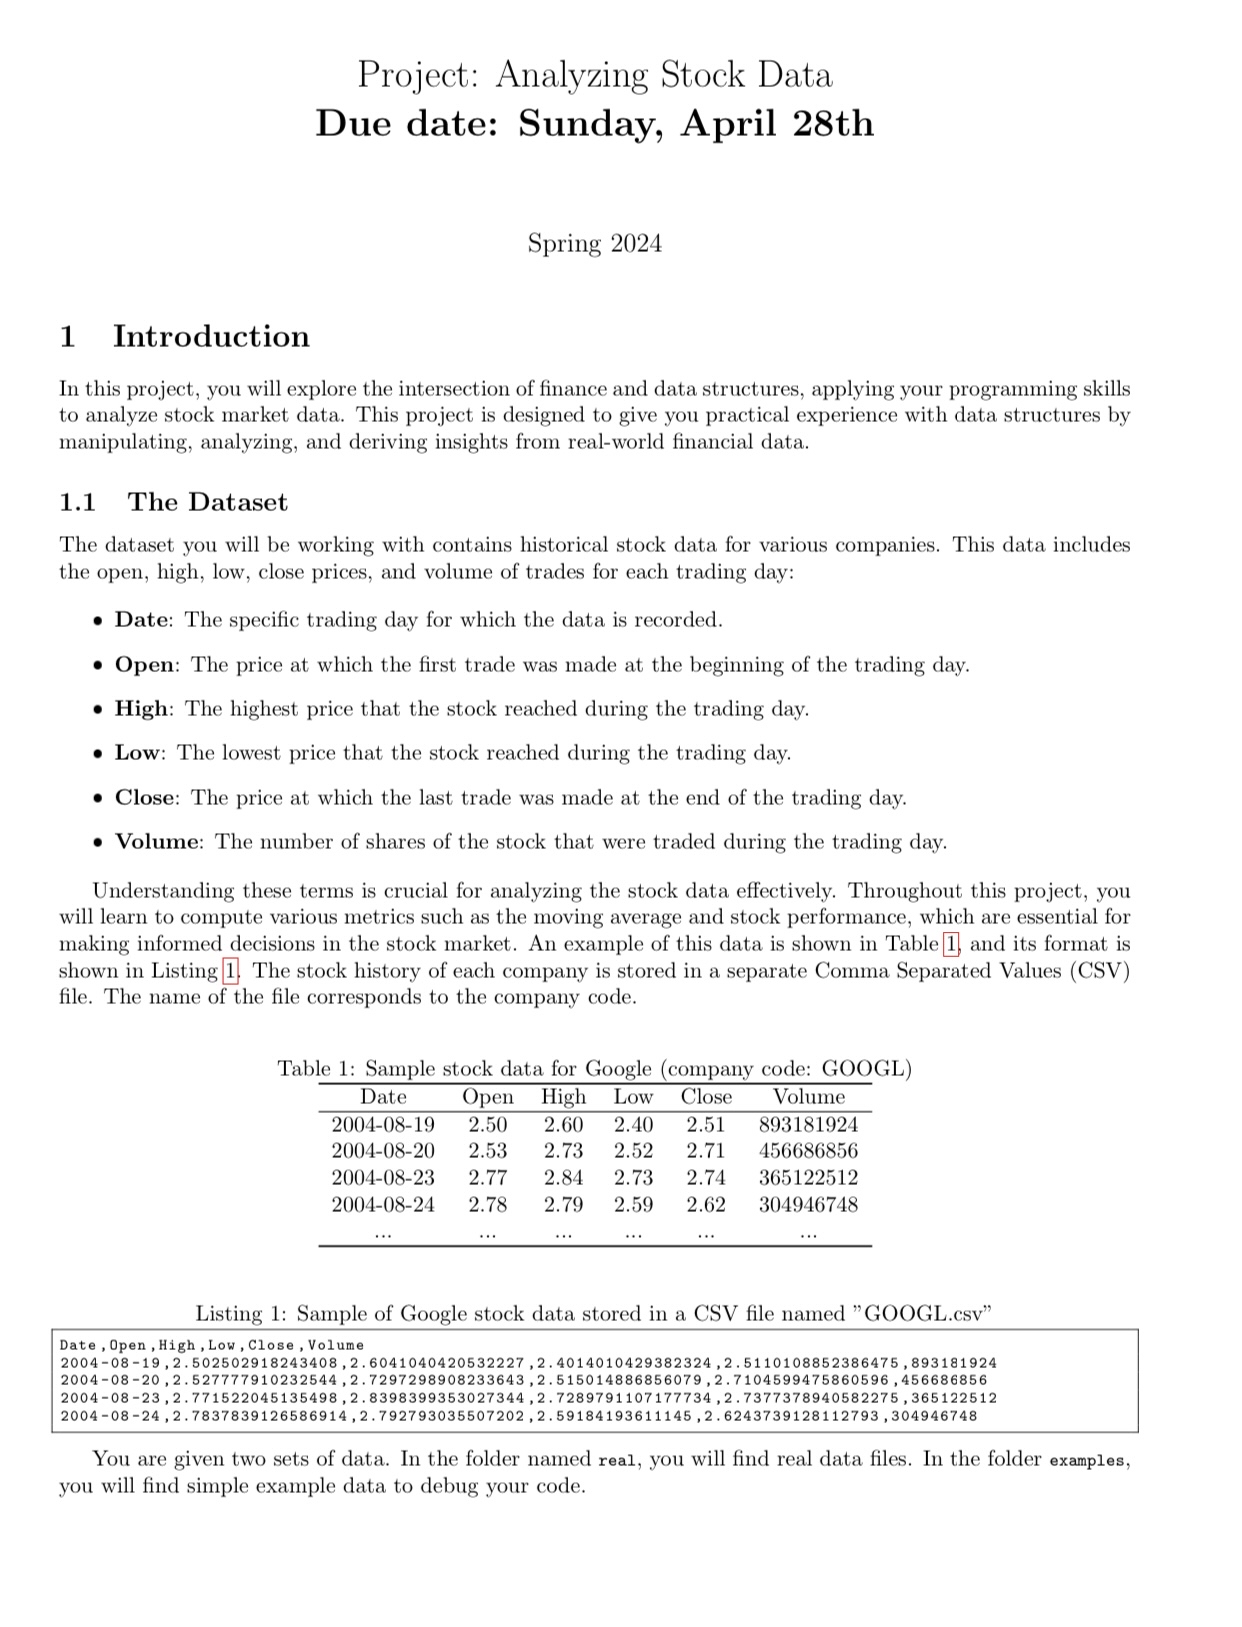
Understanding these terms is crucial for analyzing the stock data effectively. Throughout this project, you will learn to compute various metrics such as the moving average and stock performance, which are essential for making informed decisions in the stock market. An example of this data is shown in Table and its format is shown in Listing The stock history of each company is stored in a separate Comma Separated Values CSV file. The name of the file corresponds to the company code.
Table : Sample stock data for Google company code: GOOGL
tableDateOpen,High,Low,Close,Volumedots,dots,dots,dots,dots
Step by Step Solution
There are 3 Steps involved in it
1 Expert Approved Answer
Step: 1 Unlock

Question Has Been Solved by an Expert!
Get step-by-step solutions from verified subject matter experts
Step: 2 Unlock
Step: 3 Unlock