

Question: Project Control: In the bar chart below, the lighter bars indicate the actually time spent on each activity and the darker bars show planned durations.
Project Control:
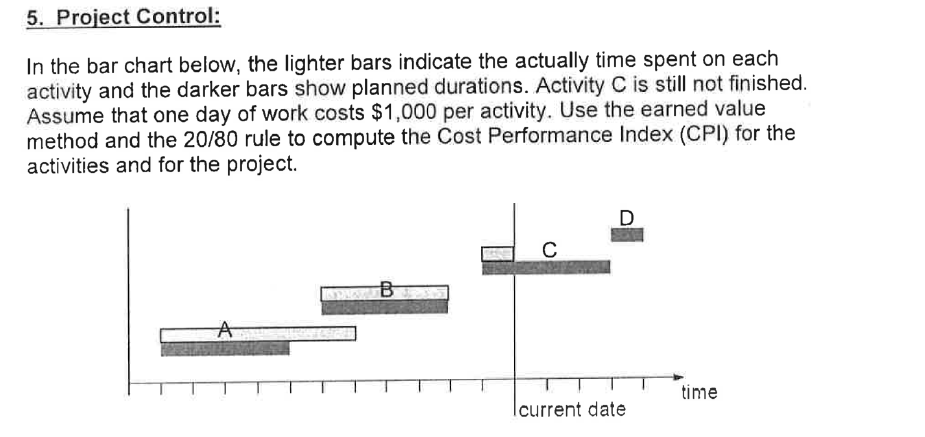
In the bar chart below, the lighter bars indicate the actually time spent on each activity and the darker bars show planned durations. Activity is still not finished. Assume that one day of work costs $ per activity. Use the earned value method and the rule to compute the Cost Performance Index CPI for the activities and for the project.
Step by Step Solution
There are 3 Steps involved in it
1 Expert Approved Answer
Step: 1 Unlock

Question Has Been Solved by an Expert!
Get step-by-step solutions from verified subject matter experts
Step: 2 Unlock
Step: 3 Unlock