

Question: Project Description Plastique Ltd . , established in 1 9 7 0 , is a manufacturer of plastic products. Starting from a small, family -
Project Description
Plastique Ltd established in is a manufacturer of plastic products. Starting from a small, familyrun business with a small core team, it has grown into a wellknown household name. The companys financial statements showed revenue of INR Crores for its three business units. Plastique Ltd produces product groups, with end products. It offers brands in eight market segments. It acts as a raw input provider for a multitude of industries ranging from retail and healthcare to automotive parts.
Because of the scale of the operations, the company has set up three inhouse plants, with the total annual production capacity amounting to million kgs per annum. The plants operate for days per month or days per annum. The table below provides the distribution of plant capacities and the number of types of products each plant produces.
Plant P P P
Number of types of products
Production Capacity
Total Number of types of products
Total Production Capacity
Furthermore, each plant has operations associated with the production process. These can be considered as the work centres. Each plant has a set of operations that relate to the specific products being produced at the plant. For example, if P produces mugs, then only P can produce mugs. In case P is inoperational, the production of mugs halts.
Mr Sunil, the CEO of Plastique Ltd has asked the operations manager to provide a forecast of the demand for the upcoming fiscal year for the products produced by P The forecast is detailed in the file attached to the link provided below.
Forecast Data is shared below, which contains:
Production Data
Sales Data
The first tab of the sheet of the file contains details of the companys performance and the accuracy of the forecast for the last months of the financial year The second part of the table details the plants plan for production, along with the capacity and the demand forecast data generated by the demand planner.
The second tab of the sheet of the file provides details on the sales for the previous fiscal year and maps it to the demand forecast.
Due to internal recalibrations, Mr Sunil has hired you, an operational consultant, to verify the calculated metrics. The brief provided by Mr Sunil is mentioned below.
Project Objectives
Evaluate the frameworks used in planning and analysing operations of a manufacturing plant at Plastique Ltd
Decide the courses of action needed to improve operations at Plastique Ltd
Based on the objectives mentioned by Mr Sunil, your team comes up with the following action items:
Generate demand forecast for the upcoming fiscal year.
Compare the generated forecast to the precalculate demand forecast by the demand planner.
Judge if the current capacity of P could meet the demand.
Calculate the aggregate demand monthly Closing Inventory CI and Production Plan PP
Questions to be answered.
Questions to be addressed for the solution:
Based on the sales data in the second tab of the sheet Sales data for the period Apr to Mar you are required to generate the forecast for the next months period Apr to Mar using suitable techniques and compute the corresponding forecast error metrics. marks
Based on the above, which technique is more reliable and why? How effective are your forecasted figures compared with those of the demand planning team as shown in the first sheet Production Data marks
Is the aggregate production capacity in P sufficient to meet the expected future demand? Would there be a need for contract manufacturing outsourcing in the future? marks
Can you calculate the aggregate monthly Closing Inventory CI and Production Plan PP based on the following inputs? What is the impact on CI and PP if the Safety Stock SS level is altered, ie increased by marks
Safety Stock SS of the Monthly Demand Forecast DF
Production Plan PP Demand Forecast DF Safety Stock SS Opening Inventory OI
Closing Inventory CI Opening Inventory OI Production Plan PP Demand Forecast DF
Consider 'Opening Inventory OI Million Kgs At the end of Mar
Closing Inventory CI at the end of month M Opening Inventory at the start of month M
Calculation Period Apr to Sep Months
Forecast Data is as follows:
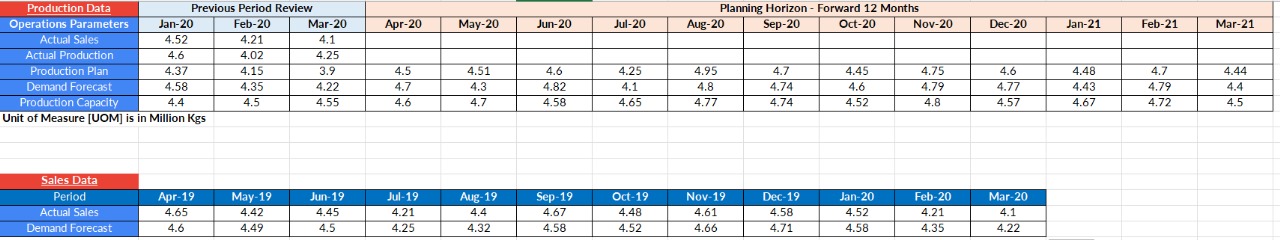
Production Data Also Uploaded in the Image
Production Data Previous Period Review Planning Horizon Forward Months
Operations Parameters Jan Feb Mar Apr May Jun Jul Aug Sep Oct Nov Dec Jan Feb Mar
Actual Sales
Actual Production
Production Plan
Demand Forecast
Production
Sales Data:
Uploaded in the Image
Step by Step Solution
There are 3 Steps involved in it
1 Expert Approved Answer
Step: 1 Unlock

To answer the questions effectively well approach them step by step Question 1 Generate the Forecast and Compute Forecast Error Metrics Exponential Sm... View full answer
Question Has Been Solved by an Expert!
Get step-by-step solutions from verified subject matter experts
Step: 2 Unlock
Step: 3 Unlock