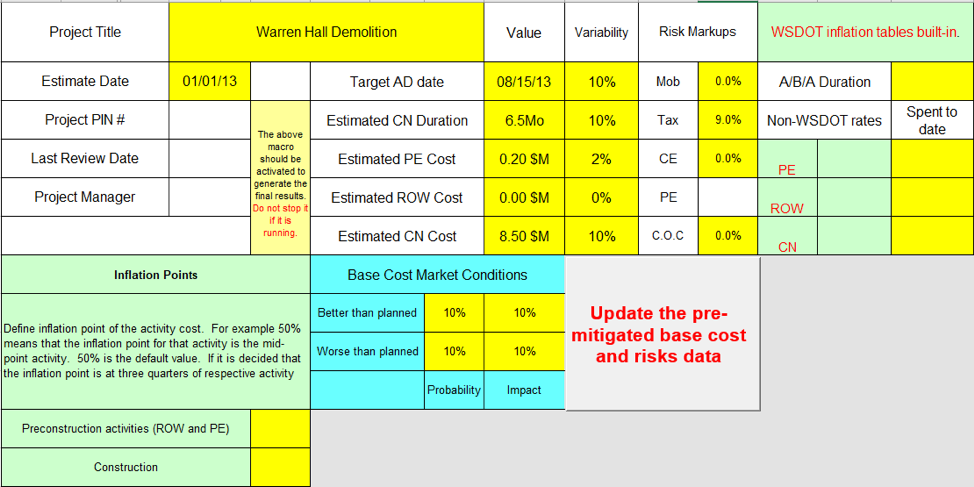
Project Name: Warren Hall Demolition
Estimate Date: 01/01/2013 (Start Date)
Target AD Date: 08/15/2013 (End Date)
Estimated Construction Duration: 6.5 Mo
PE Cost: $200,000
ROW $0
CN Cost: $8,500,000
Tax 9%
Pre mitigated Base Costs:
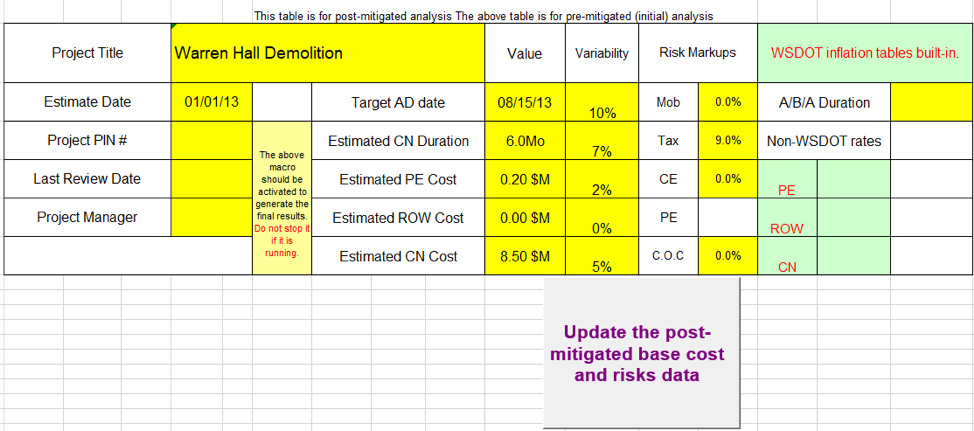
Post- mitigated:
Risks:
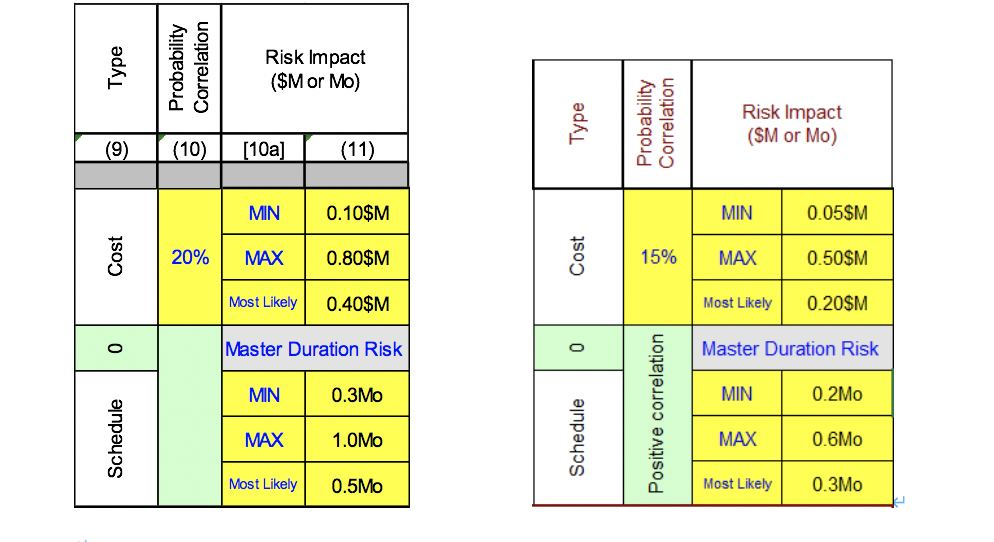
Risk 1: Unabated asbestos Threat (pre and post mitigated):
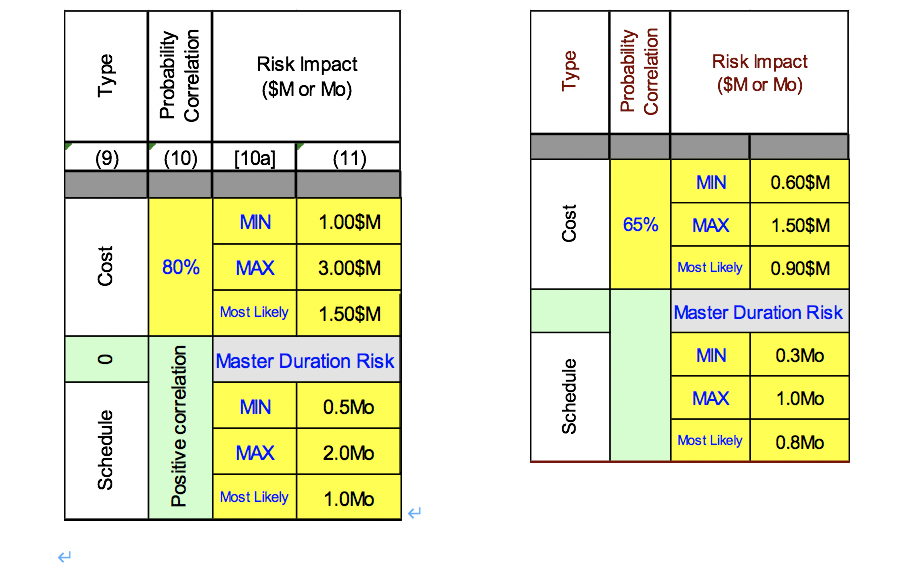
Risk 2: flawless Demolition Opportunity (pre and post mitigated):
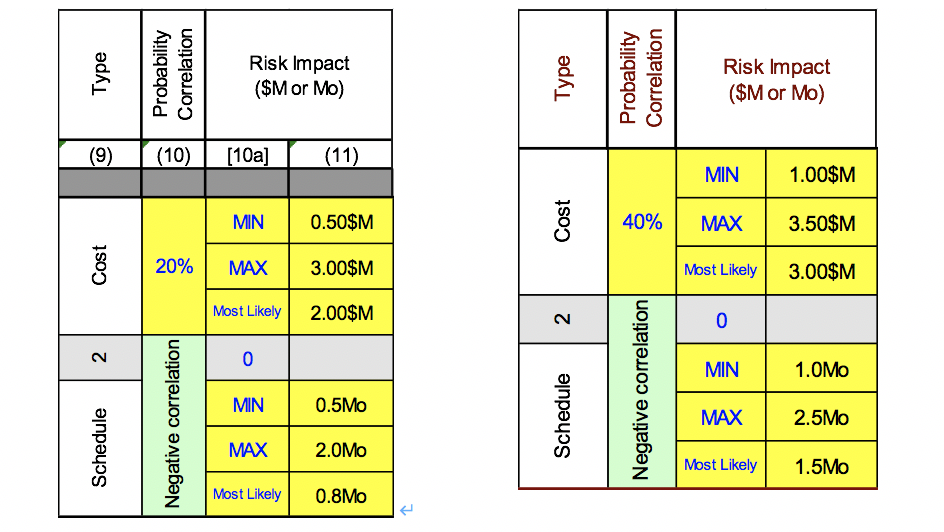
Risk 3: PCB Contamination Threat (pre and post mitigated):
Risk 4: Regulatory restriction on Demolition w/ Explosives Threat (pre and post mitigated):
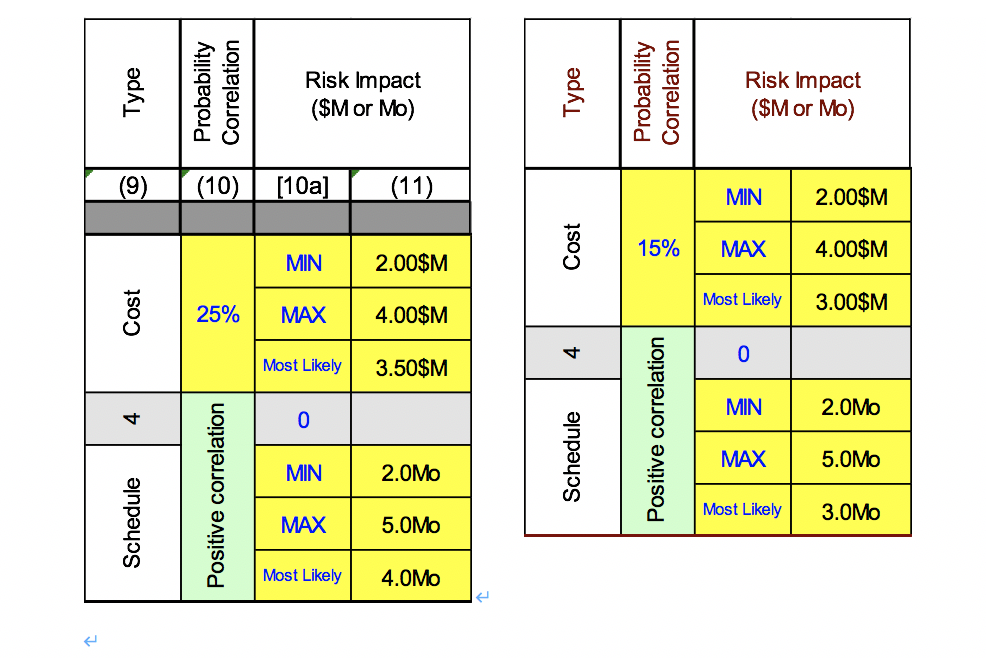
Project Title Warren Hall Demolition Value Variability Risk Markups WSDOT inflation tables built-in. Estimate Date 01/01/13 Target AD date 08/15/13 10% Mob 0.0% A/B/A Duration Project PIN # Estimated CN Duration 6.5Mo Spent to 10% Tax Non-WSDOT rates 9.0% Last Review Date Estimated PE Cost 0.20 SM 2% CE 0.0% PE The above macro should be activated to generate the final results. Do not stop it if it is running Project Manager Estimated ROW Cost 0.00 SM 0% PE ROW Estimated CN Cost 8.50 SM 10% CO.C 0.0% Inflation Points Base Cost Market Conditions Better than planned 10% 10% Define inflation point of the activity cost. For example 50% means that the inflation point for that activity is the mid- point activity. 50% is the default value. If it is decided that the inflation point is at three quarters of respective activity Update the pre- mitigated base cost and risks data Worse than planned 10% 10% Probability Impact Preconstruction activities (ROW and PE) Construction This table is for post-mitigated analysis The above table is for pre-mitigated (initial) analysis Project Title Warren Hall Demolition Value Variability Risk Markups WSDOT inflation tables built-in. Estimate Date 01/01/13 Target AD date 08/15/13 Mob 0.0% A/B/A Duration Project PIN # Estimated CN Duration 6.OMO Tax 9.0% Non-WSDOT rates 7% Last Review Date Estimated PE Cost 0.20 $M 0.0% 2% The above macro should be activated to generate the final results Do not stop it if it is running Project Manager Estimated ROW Cost 0.00 $M PE 0% ROW Estimated CN Cost 8.50 $M C.O.C. 0.0% 5% Update the post- mitigated base cost and risks data Type Probability Correlation Risk Impact ($M or Mo) Type Probability Correlation Risk Impact ($M or Mo) (9) I (10) [100] (11) MIN 0.60$M MIN 1.00$M Cost 65% MAX 1.50$M Cost 80% MAX 3.00$M Most Likely | 0.90$M Most Likely 1.50$M Master Duration Risk 0 Master Duration Risk MIN 0.3Mo MIN 0.5MO Schedule MAX 1.OMO Schedule Positive correlation Most Likely 0.8Mo MAX 2.OMO Most Likely 11.0MO Type Probability Correlation Risk Impact ($M or Mo) Type Probability Correlation Risk Impact ($M or Mo) (9) (10) 1 (10a] (11) MIN 1.00$M MIN 0.50$M Cost MAX 3.50$M Cost 0% MAX 3.00$M Most Likely 3.00$M Most Likely 2.00$M 0 MIN 1.0M MIN Negative correlation 0.5MO Negative correlation Schedule Schedule MAX | 2.5MO MAX 2.OMO Most Likely 1.5MO Most Likely 0.8MO Type Probability Correlation Risk Impact ($M or Mo) Type Probability Correlation Risk Impact ($M or Mo) (10) [10a] (11) MIN 2.00$M Cost MAX 4.00$M MIN 2.00$M Most Likely Cost 3.00$M 25% MAX 4.00$M 0 Most Likely | 4 3.50$M 0 MIN | 2.0MO Schedule MAX Positive correlation 5.OMO MIN 2.OMO Positive correlation Schedule Most Likely 5.0MO MAX 3.0MO Most Likely 4.OMO Project Title Warren Hall Demolition Value Variability Risk Markups WSDOT inflation tables built-in. Estimate Date 01/01/13 Target AD date 08/15/13 10% Mob 0.0% A/B/A Duration Project PIN # Estimated CN Duration 6.5Mo Spent to 10% Tax Non-WSDOT rates 9.0% Last Review Date Estimated PE Cost 0.20 SM 2% CE 0.0% PE The above macro should be activated to generate the final results. Do not stop it if it is running Project Manager Estimated ROW Cost 0.00 SM 0% PE ROW Estimated CN Cost 8.50 SM 10% CO.C 0.0% Inflation Points Base Cost Market Conditions Better than planned 10% 10% Define inflation point of the activity cost. For example 50% means that the inflation point for that activity is the mid- point activity. 50% is the default value. If it is decided that the inflation point is at three quarters of respective activity Update the pre- mitigated base cost and risks data Worse than planned 10% 10% Probability Impact Preconstruction activities (ROW and PE) Construction This table is for post-mitigated analysis The above table is for pre-mitigated (initial) analysis Project Title Warren Hall Demolition Value Variability Risk Markups WSDOT inflation tables built-in. Estimate Date 01/01/13 Target AD date 08/15/13 Mob 0.0% A/B/A Duration Project PIN # Estimated CN Duration 6.OMO Tax 9.0% Non-WSDOT rates 7% Last Review Date Estimated PE Cost 0.20 $M 0.0% 2% The above macro should be activated to generate the final results Do not stop it if it is running Project Manager Estimated ROW Cost 0.00 $M PE 0% ROW Estimated CN Cost 8.50 $M C.O.C. 0.0% 5% Update the post- mitigated base cost and risks data Type Probability Correlation Risk Impact ($M or Mo) Type Probability Correlation Risk Impact ($M or Mo) (9) I (10) [100] (11) MIN 0.60$M MIN 1.00$M Cost 65% MAX 1.50$M Cost 80% MAX 3.00$M Most Likely | 0.90$M Most Likely 1.50$M Master Duration Risk 0 Master Duration Risk MIN 0.3Mo MIN 0.5MO Schedule MAX 1.OMO Schedule Positive correlation Most Likely 0.8Mo MAX 2.OMO Most Likely 11.0MO Type Probability Correlation Risk Impact ($M or Mo) Type Probability Correlation Risk Impact ($M or Mo) (9) (10) 1 (10a] (11) MIN 1.00$M MIN 0.50$M Cost MAX 3.50$M Cost 0% MAX 3.00$M Most Likely 3.00$M Most Likely 2.00$M 0 MIN 1.0M MIN Negative correlation 0.5MO Negative correlation Schedule Schedule MAX | 2.5MO MAX 2.OMO Most Likely 1.5MO Most Likely 0.8MO Type Probability Correlation Risk Impact ($M or Mo) Type Probability Correlation Risk Impact ($M or Mo) (10) [10a] (11) MIN 2.00$M Cost MAX 4.00$M MIN 2.00$M Most Likely Cost 3.00$M 25% MAX 4.00$M 0 Most Likely | 4 3.50$M 0 MIN | 2.0MO Schedule MAX Positive correlation 5.OMO MIN 2.OMO Positive correlation Schedule Most Likely 5.0MO MAX 3.0MO Most Likely 4.OMO


