

Question: Project Problem 1, Develop a linear regression model of the price of a used car relative to its age. The age is defined as age
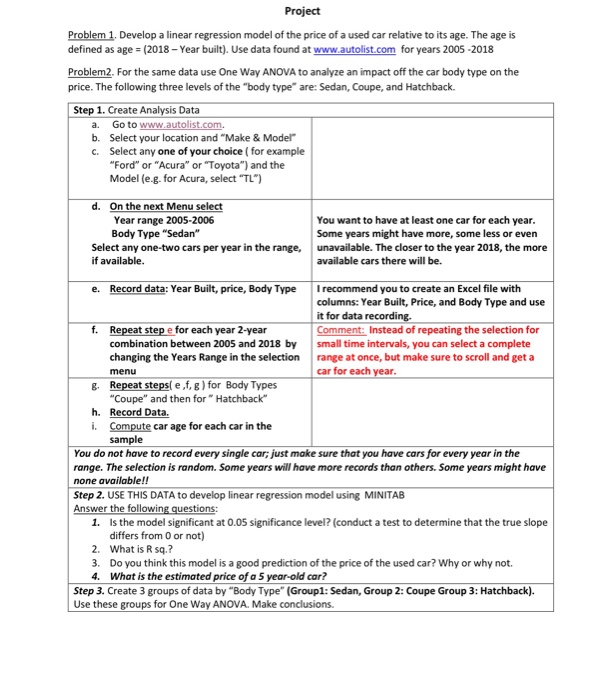
Project Problem 1, Develop a linear regression model of the price of a used car relative to its age. The age is defined as age (2018-Year built). Use data found at www.autolist.com for years 2005-2018 Problem2. For the same data use One Way ANOVA to analyze an impact off the car body type on the price. The following three levels of the "body type" are: Sedan, Coupe, and Hatchback. Step 1. Create A Data a. Go to www.autolist.com. b. Select your location and "Make & Model" c. Select any one of your choice(for example "Ford" or "Acura" or "Toyota") and the Model (e.g. for Acura, select "TL) d. On the next Menu select Year range 2005-2006 Body Type "Sedan" You want to have at least one car for each year Some years might have more, some less or even unavailable. The closer to the year 2018, the more available cars there will be. Select any one-two cars per year in the range, Record data: Year Built, price, Body Type I recommend you to create an Excel file with columns: Year Built, Price, and Body Type and use it for data recording Comment: Instead of repeating the selection for e. f. Repeat step e for each year 2-year combination between 2005 and 2018 by small time intervals, you can select a complete changing the Years Range in the selection range at once, but make sure to scroll and get a menu Repeat steps( e,f, g) for Body Types "Coupe" and then for Hatchback Record Data. Compute car age for each car in the sample car for each y g. h. i. You do not have to record every single car: just make sure that you have cars for every year in the range. The selection is random. Some years will have more records than others. Some years might have none available!! Step 2. USE THIS DATA to develop linear regression model using MINITAB Answer the followin Is the model significant at 0.05 significance level? (conduct a test to determine that the true slope differs from 0 or not) What is R sq.? Do you think this model is a good prediction of the price of the used car? Why or why not. What is the estimated price of a 5 year-old car? 1. 2. 3. 4. Step 3. Create 3 groups of data by "Body Type" (Group1: Sedan, Group 2: Coupe Group 3: Hatchback). Use these groups for One Way ANOVA. Make conclusions. Project Problem 1, Develop a linear regression model of the price of a used car relative to its age. The age is defined as age (2018-Year built). Use data found at www.autolist.com for years 2005-2018 Problem2. For the same data use One Way ANOVA to analyze an impact off the car body type on the price. The following three levels of the "body type" are: Sedan, Coupe, and Hatchback. Step 1. Create A Data a. Go to www.autolist.com. b. Select your location and "Make & Model" c. Select any one of your choice(for example "Ford" or "Acura" or "Toyota") and the Model (e.g. for Acura, select "TL) d. On the next Menu select Year range 2005-2006 Body Type "Sedan" You want to have at least one car for each year Some years might have more, some less or even unavailable. The closer to the year 2018, the more available cars there will be. Select any one-two cars per year in the range, Record data: Year Built, price, Body Type I recommend you to create an Excel file with columns: Year Built, Price, and Body Type and use it for data recording Comment: Instead of repeating the selection for e. f. Repeat step e for each year 2-year combination between 2005 and 2018 by small time intervals, you can select a complete changing the Years Range in the selection range at once, but make sure to scroll and get a menu Repeat steps( e,f, g) for Body Types "Coupe" and then for Hatchback Record Data. Compute car age for each car in the sample car for each y g. h. i. You do not have to record every single car: just make sure that you have cars for every year in the range. The selection is random. Some years will have more records than others. Some years might have none available!! Step 2. USE THIS DATA to develop linear regression model using MINITAB Answer the followin Is the model significant at 0.05 significance level? (conduct a test to determine that the true slope differs from 0 or not) What is R sq.? Do you think this model is a good prediction of the price of the used car? Why or why not. What is the estimated price of a 5 year-old car? 1. 2. 3. 4. Step 3. Create 3 groups of data by "Body Type" (Group1: Sedan, Group 2: Coupe Group 3: Hatchback). Use these groups for One Way ANOVA. Make conclusions
Step by Step Solution
There are 3 Steps involved in it

Get step-by-step solutions from verified subject matter experts