

Question: Project risk analysis Costs, Projects A and B Expected life of projects (in years) Difference between Project A CFs Project A. begin{tabular}{|c|r|} hline Probability &
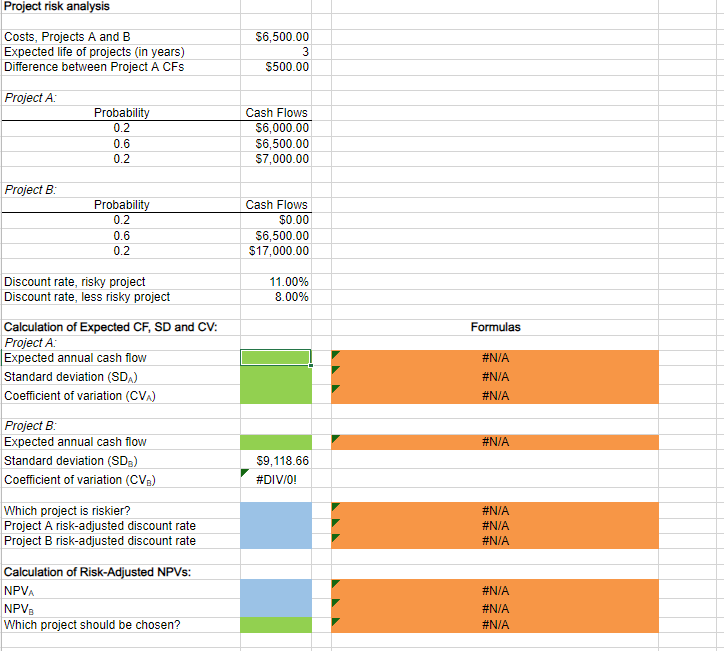
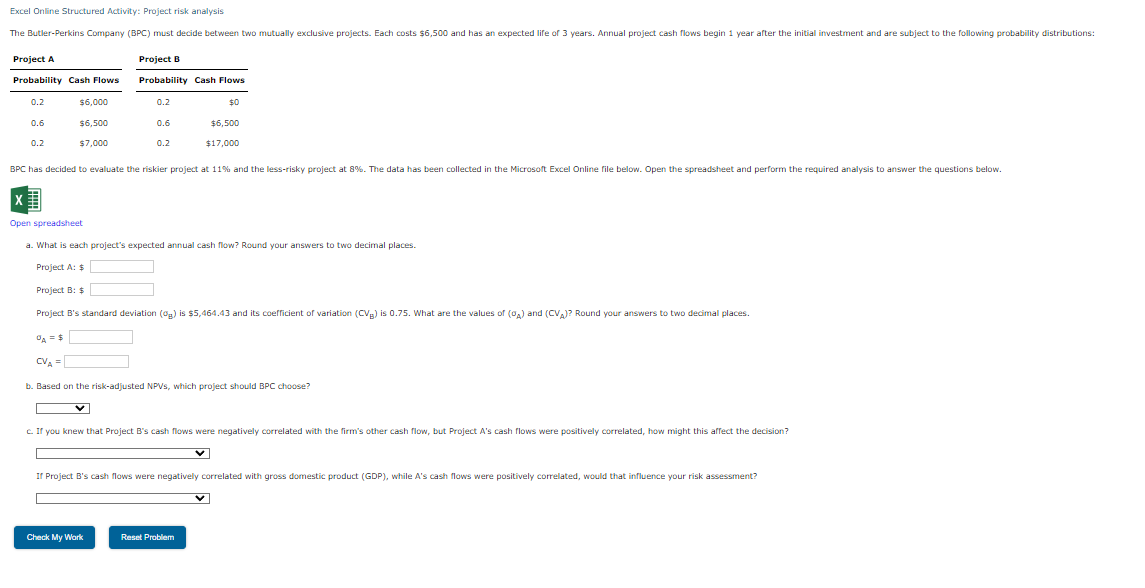
Project risk analysis Costs, Projects A and B Expected life of projects (in years) Difference between Project A CFs Project A. \begin{tabular}{|c|r|} \hline Probability & Cash Flows \\ \hline 0.2 & $6,000.00 \\ \hline 0.6 & $6,500.00 \\ \hline 0.2 & $7,000.00 \\ \hline Project B: & \\ \hline Probability & Cash Flows \\ \hline 0.2 & $0.00 \\ \hline 0.6 & $6,500.00 \\ \hline 0.2 & $17,000.00 \\ \hline Discount rate, risky project & 11.00% \\ \hline Discount rate, less risky project & 8.00% \\ \hline \end{tabular} Calculation of Expected CF, SD and CV: Project A. Expected annual cash flow Standard deviation (SDA) Coefficient of variation (CVA) Project B : Expected annual cash flow Standard deviation (SDB) Coefficient of variation (CVB) Which project is riskier? Project A risk-adjusted discount rate Project B risk-adjusted discount rate Calculation of Risk-Adjusted NPVs: NPVA NPVB Which project should be chosen? $6,500.00 $500.00 Formulas \#N/A \#N/A \#N/A \#N/A $9,118.66 \#DIV/O! \#N/A \#N/A \#N/A \#N/A \#N/A \#N/A Excel Online Structured Activity: Project risk analysis Open spreadsheet a. What is each project's expected annual cash flow? Round your answers to two decimal places. Project A: $ Project B: $ oA=$CVA= b. Based on the risk-adjusted NPVs, which project should BPC choose
Step by Step Solution
There are 3 Steps involved in it

Get step-by-step solutions from verified subject matter experts