

Question: calculate profitability metrics, credit metrics, cash flow metrics, per share metrics Reclassified 12 months Dec-31-2017 USD Reclassified 12 months Dec-31-2018 USD LTM 12 months Jun-30-2021
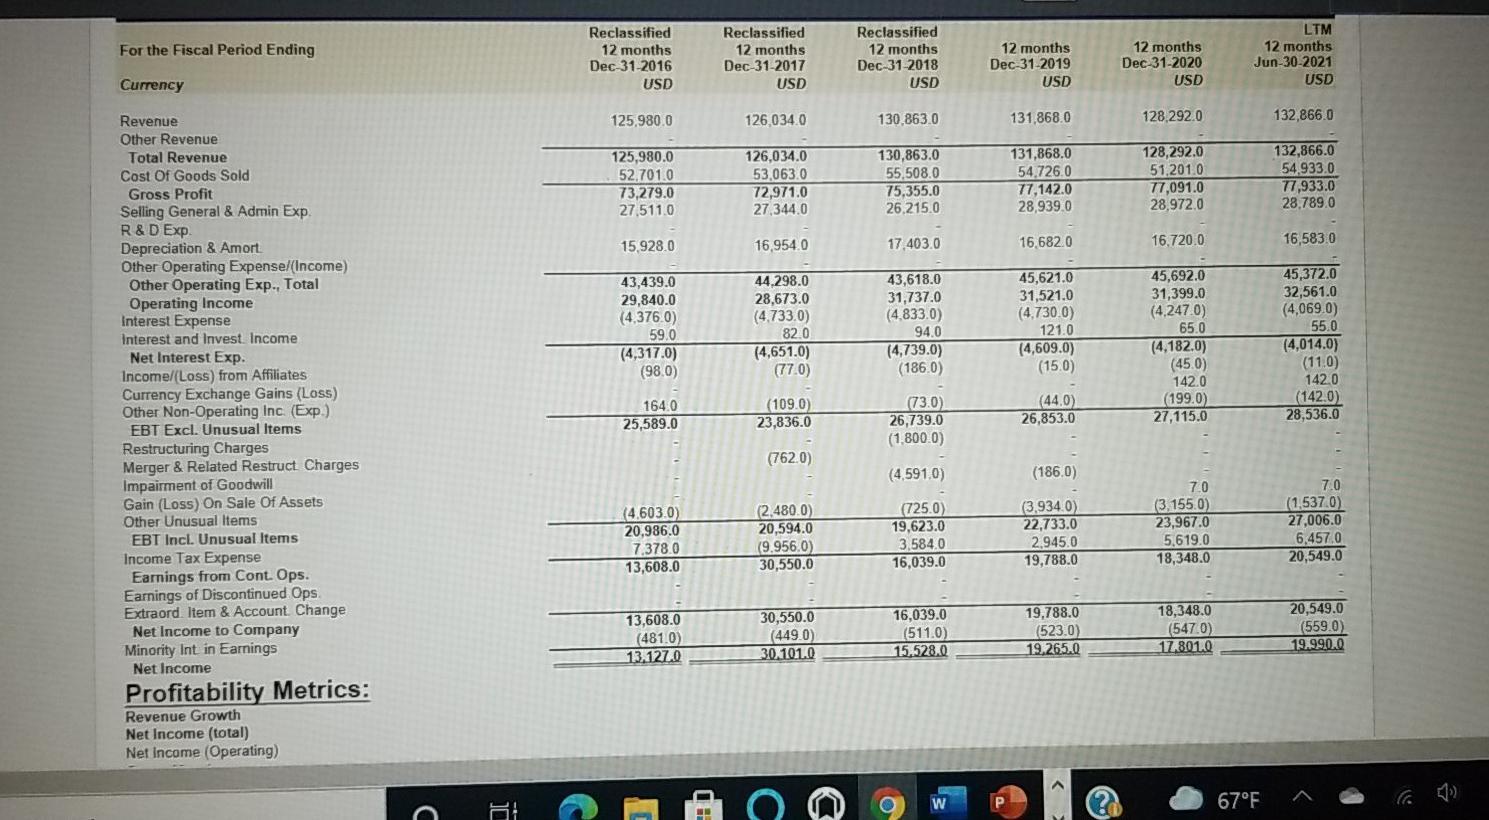
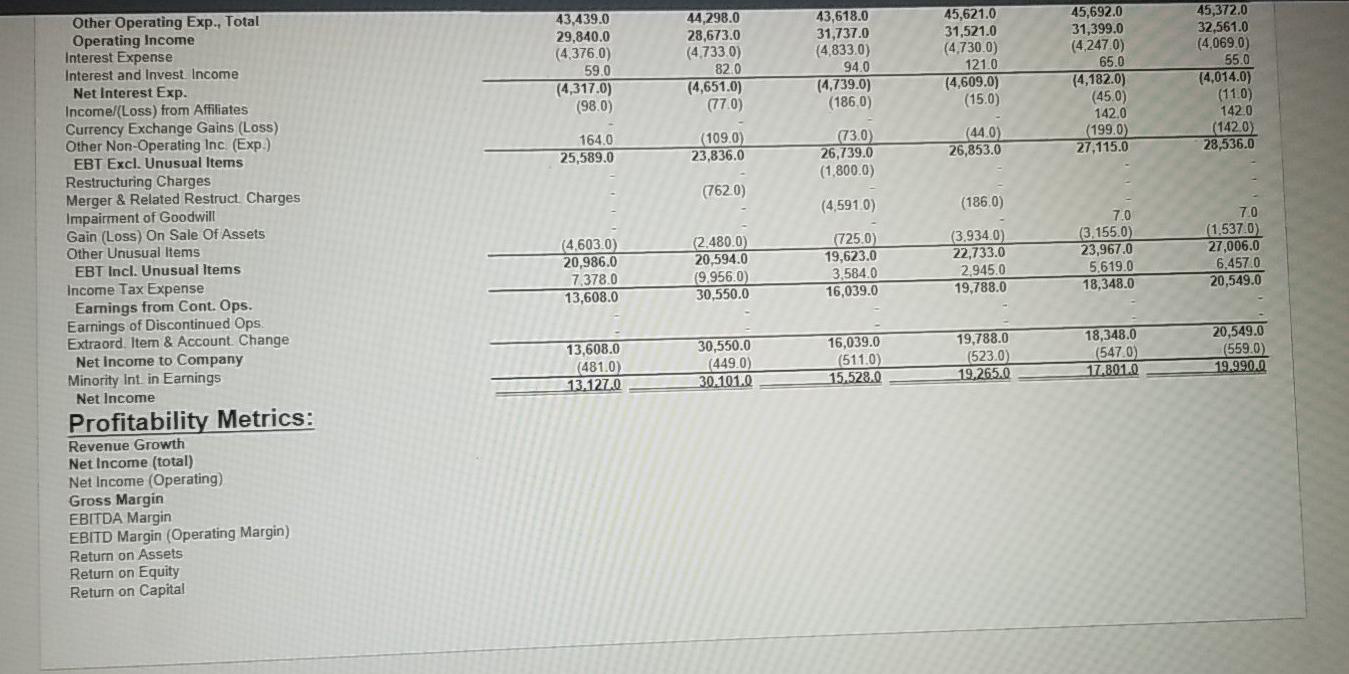
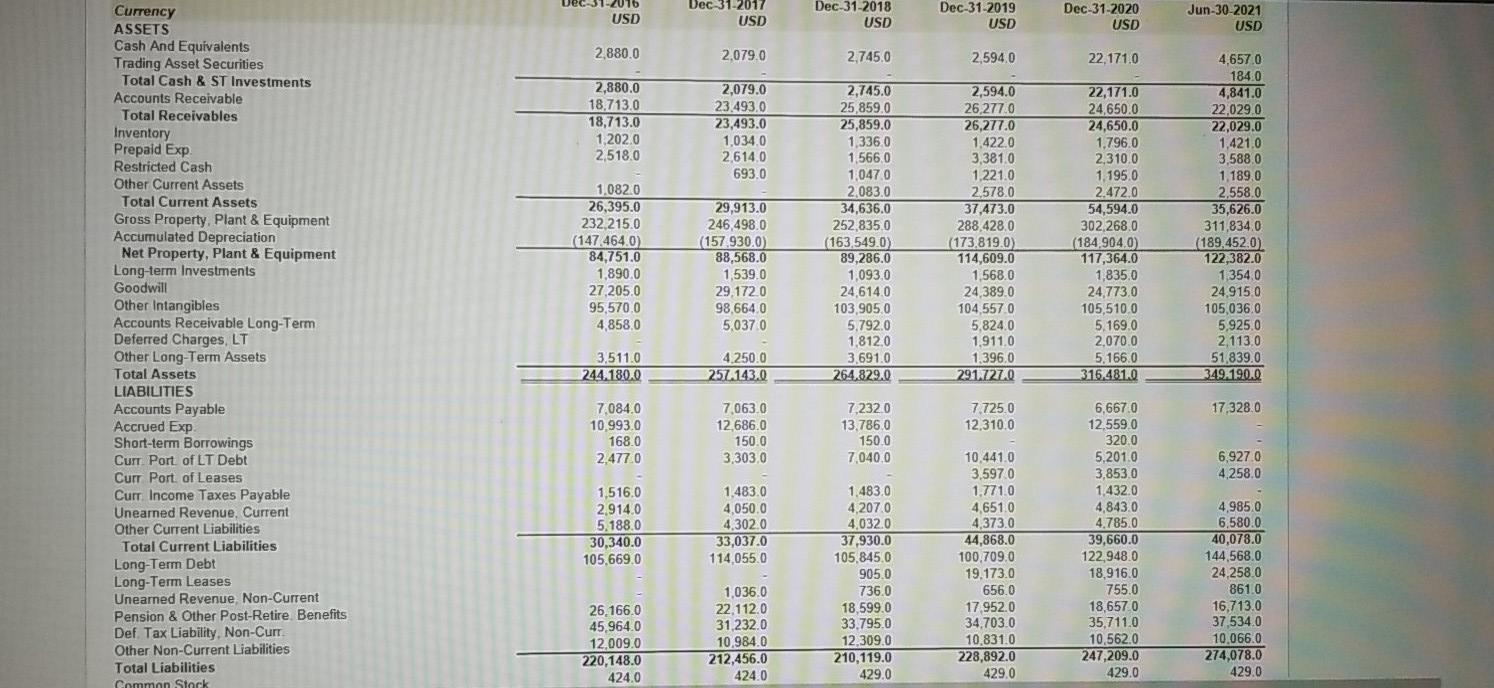
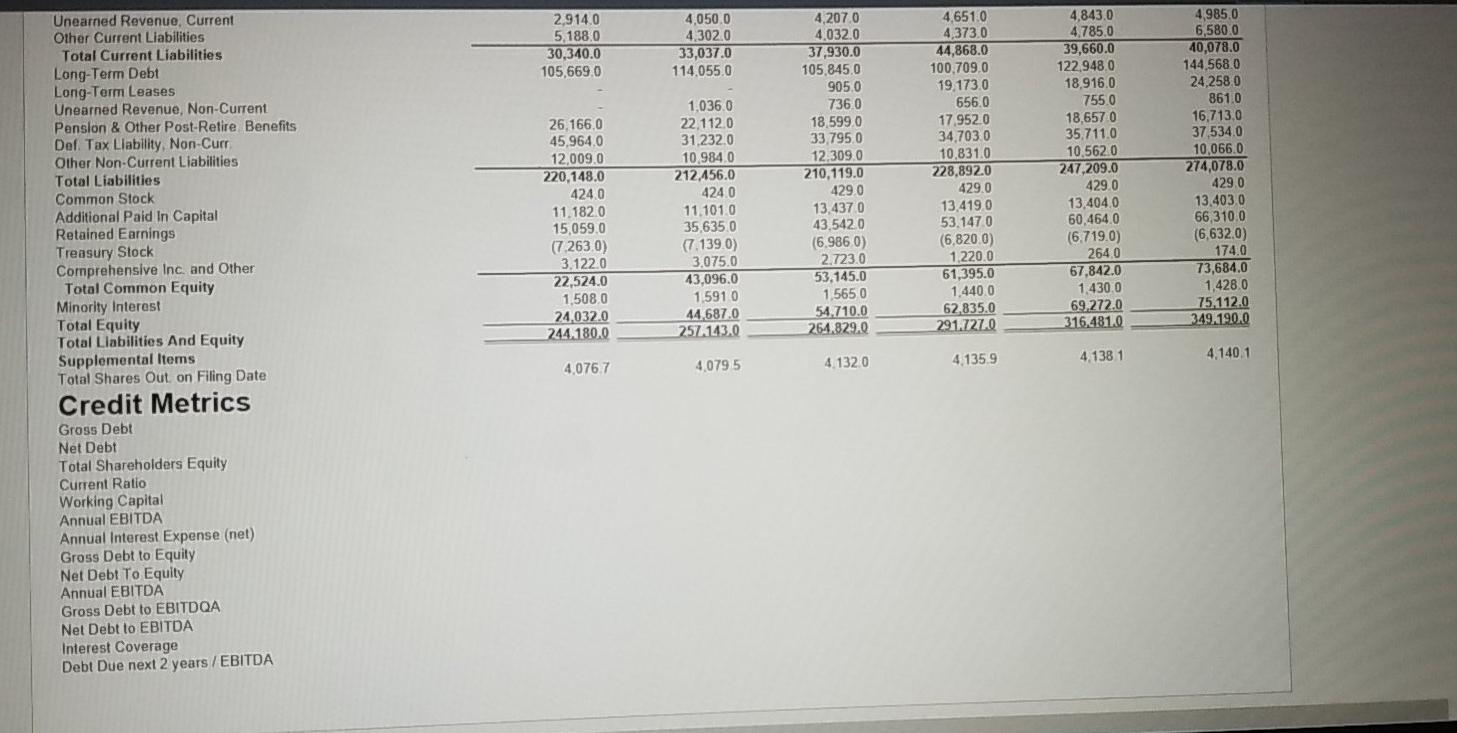
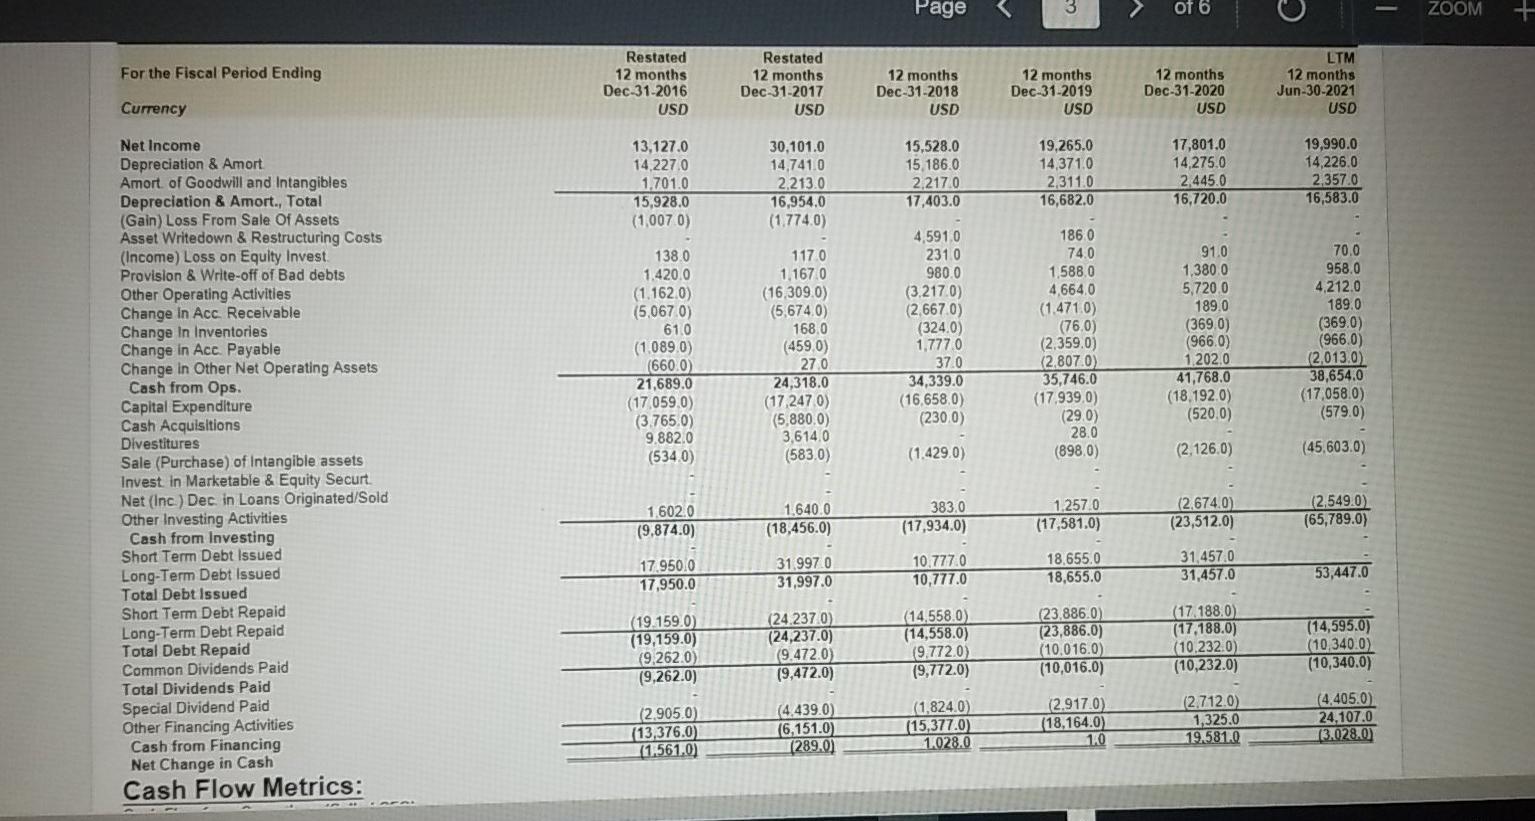
calculate profitability metrics, credit metrics, cash flow metrics, per share metrics
Reclassified 12 months Dec-31-2017 USD Reclassified 12 months Dec-31-2018 USD LTM 12 months Jun-30-2021 Reclassified For the Fiscal Period Ending 12 months Dec 31-2020 USD 12 months 12 months Dec-31-2016 Dec-31-2019 Currency USD USD USD 131,868.0 128,292.0 132,866.0 Revenue Other Revenue 125,980.0 126,034.0 130,863.0 132,866.0 54,933.0 77,933.0 28,789.0 131.868.0 128.292.0 130,863.0 55,508.0 125,980.0 126,034.0 53,063.0 Total Revenue 52,701.0 73,279.0 27,511.0 54,726.0 77,142.0 28,939.0 51.201.0 77,091.0 28,972.0 Cost Of Goods Sold Gross Profit Selling General & Admin Exp. R&DExp. Depreciation & Amort Other Operating Expense/(Income) Other Operating Exp., Total Operating Income Interest Expense Interest and Invest. Income Net Interest Exp. Income/(Loss) from Affiliates Currency Exchange Gains (Loss) Other Non-Operating Inc. (Exp.) EBT Excl. Unusual Items 75,355.0 72,971.0 27,344.0 26,215.0 15,928.0 16,954.0 17,403.0 16,682.0 16,720.0 16,583.0 45,372.0 45,692.0 31,399.0 (4,247.0) 65.0 45,621.0 43,618.0 31,737.0 (4,833.0) 94.0 44,298.0 43,439.0 29,840.0 (4,376.0) 59.0 (4,317.0) (98.0) 31,521.0 (4,730.0) 121.0 (4,609.0) (15.0) 32,561.0 (4,069.0) 55.0 (4,014.0) (11.0) 142.0 (142.0) 28,536.0 28,673.0 (4,733.0) 82.0 (4,651.0) (77.0) (4,739.0) (186.0) (4,182.0) (45.0) 142.0 (109.0) 23,836.0 (73.0) 26,739.0 (44.0) 26,853.0 (199.0) 27,115.0 164.0 25,589.0 (1,800.0) Restructuring Charges Merger & Related Restruct Charges Impairment of Goodwill Gain (Loss) On Sale Of Assets Other Unusual Items EBT Incl. Unusual Items Income Tax Expense Earnings from Cont. Ops. Earnings of Discontinued Ops. Extraord. Item & Account. Change Net Income to Company Minority Int in Earnings (762.0) (4,591.0) (186.0) 7.0 7.0 (1,537.0) 27,006.0 (4.603.0) 20.986.0 7,378.0 (2,480.0) 20,594.0 (9.956.0) 30,550.0 (725.0) 19,623.0 3,584.0 16,039.0 (3,934.0) 22,733.0 2,945.0 19,788.0 (3,155.0) 23,967.0 5.619.0 18,348.0 6,457.0 20,549.0 13,608.0 13,608.0 (481.0) 13.127.0 30,550.0 (449.0) 30.101.0 16,039.0 (511.0) 15.528.0 19,788.0 (523.0) 19.265.0 18,348.0 (547.0) 17.801.0 20,549.0 (559.0) 19.990.0 Net Income Profitability Metrics: Revenue Growth Net Income (total) Net income (Operating) 67F
Step by Step Solution
3.49 Rating (156 Votes )
There are 3 Steps involved in it

Get step-by-step solutions from verified subject matter experts