

Question: Projected Y11 Performance a Scoring Measures EPS (eamingsper share) ROE (retum on equity) Credit Rating Image Rating Investor Year 11 Expectation $2.28 $2.50 19.6% 21.0%
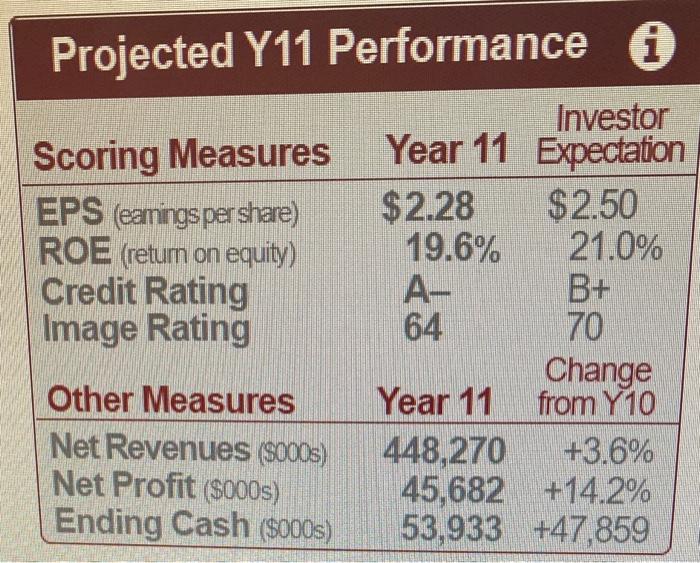
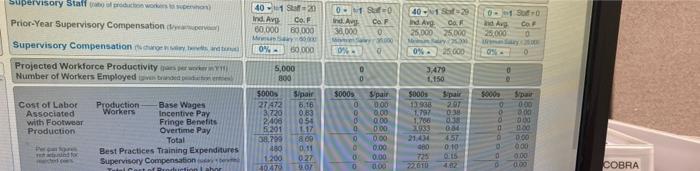
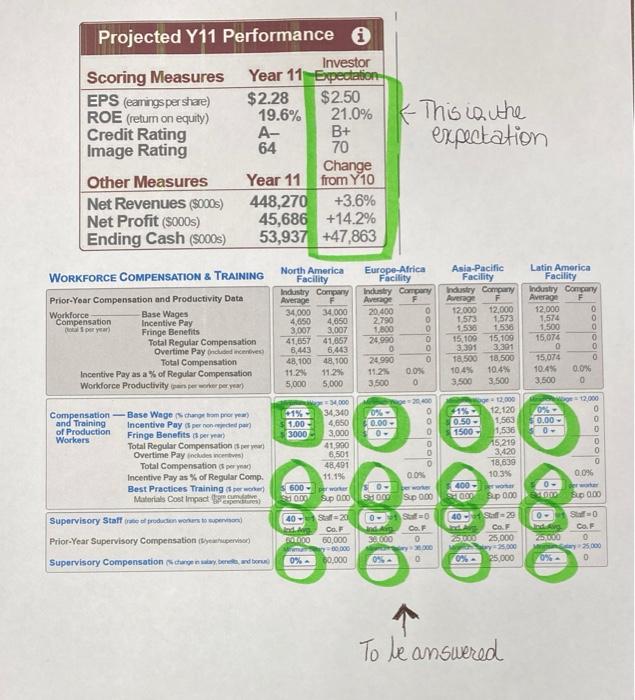
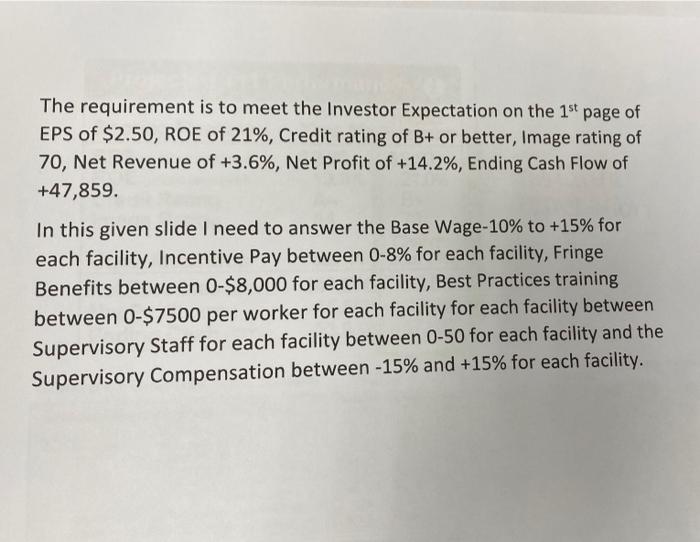
Projected Y11 Performance a Scoring Measures EPS (eamingsper share) ROE (retum on equity) Credit Rating Image Rating Investor Year 11 Expectation $2.28 $2.50 19.6% 21.0% A- B+ 64 70 Change Year 11 from Y10 448,270 +3.6% 45,682 +14.2% 53,933 +47,859 Other Measures Net Revenues ($0005) Net Profit ($000s) Ending Cash ($000) 40 Supervisory Staff Prior-Year Supervisory Compensation Ind. As S21 Cof 80,000 0 0 Ind. As COF 38,000 0 40-1 S29 C. 25.000 25,000 IN Ave 02. So Co 25,000 0 80.000 Supervisory Compensation 0%- 50 000 0%- 0% - 25.000 05 0 Projected Workforce Productivity Number of Workers Employed 5,000 800 0 0 3,479 150 5000 0 $000s 1330 5000 Spalis 201 03 0.00 1.12 200 Cost of Labor Associated wits Footwear Production 1000 5000 27472 3.720 2408 5201 3.799 480 1.200 1070 Sipar 5.16 0.83 OS 117 800 0.11 0.27 07 Production Base Wages Workers Incentive Pay Fringe Benefits Overtime Pay Total Best Practices Training Expenditures Supervisory Compensation Cat Punction har 0 0 0 pair 0.00 0.00 0.00 0.00 000 0.00 0.00 084 0 1933 21.434 080 72 0.00 000 0.00 0.00 0.10 for 0 0 0 COBRA Projected Y11 Performance 6 Investor Scoring Measures Year 11 Expectation EPS (eanings per share) $2.28 $2.50 ROE (return on equity) 19.6% 21.0% Credit Rating A- B+ Image Rating 64 70 Change Other Measures Year 11 from Y10 Net Revenues (9000) 448,270 +3.6% Net Profit (5000s) 45,686 +14.2% Ending Cash (8000) 53,937 +47,863 - This is the expectation WORKFORCE COMPENSATION & TRAINING Prior-Year Compensation and Productivity Data Workforce Base Wages Compensation Incentive Pay o per year Fringe Benefits Total Regular Compensation Overtime Pay Online Total Compensation Incentive Pay as a % of Regular Compensation Workforce Productivity in per her per year) North America Facility Industry Company Average F 34000 34.000 4.050 4,650 3.007 3.007 41,657 41,657 3,443 6.443 48.100 48,100 11.2% 11.296 5,000 5,000 Europe Africa Facility Industry Company Average F 20.400 2.790 1.800 24.900 0 24 990 11.2 0.0% 3.500 0 blooooo Asia-Pacific Facility Industry Company Average F 12.000 12,000 1573 1.573 5538 1536 15,100 15,109 3.391 3.301 18.500 18,500 10.4% 10.4% 3.500 3.500 Latin America Facility Industry Company Average F 12.000 1,574 1.500 15.074 0 15,074 10,4% 0.0% 3.500 olooooo . 12.000 05 0.00 0 - 2000 2000 34,340 0%- 1.00 4,650 $ 0.00 3000 3,000 O 41.990 6501 48,491 11.1% 0.0% S600 Purwoer ber Sup000 90 Sup000 olooooo 2.000 1% 12,120 OLO - 1,503 1500 - 1,536 15,219 3.420 18,639 10.3% 400- SHOP Rp 0,00 Compensation Base Wagehang hom pror year) and Training Incentive Pay per nonrededor of Production Workers Fringe Benefits per year) Total Regular Compensation Overtime Pay includes Total Compensation pery Incentive Pay as % of Regular Comp. Best Practices Training per we Materials Cost impact Supervisory Staff rate odcienwoners to Prior-Year Supervisory Compensation ennuperd) Supervisory Compensation Schwenyewe olo oleo 0.0% 0- Der D up 0.00 MODO 40 Sa=20 Co. BODO 60,000 0 000 60,000 0- indig 20000 Co. 40 Sof20 Co. 258 25,000 25.000 0% 25.000 Suo dag co 2000 0 25000 0% 0 0%. 0% 0 To be answered The requirement is to meet the Investor Expectation on the 1st page of EPS of $2.50, ROE of 21%, Credit rating of B+ or better, Image rating of 70, Net Revenue of +3.6%, Net Profit of +14.2%, Ending Cash Flow of +47,859. In this given slide I need to answer the Base Wage-10% to +15% for each facility, Incentive Pay between 0-8% for each facility, Fringe Benefits between 0-$8,000 for each facility, Best Practices training between 0-$7500 per worker for each facility for each facility between Supervisory Staff for each facility between 0-50 for each facility and the Supervisory Compensation between -15% and +15% for each facility. Projected Y11 Performance a Scoring Measures EPS (eamingsper share) ROE (retum on equity) Credit Rating Image Rating Investor Year 11 Expectation $2.28 $2.50 19.6% 21.0% A- B+ 64 70 Change Year 11 from Y10 448,270 +3.6% 45,682 +14.2% 53,933 +47,859 Other Measures Net Revenues ($0005) Net Profit ($000s) Ending Cash ($000) 40 Supervisory Staff Prior-Year Supervisory Compensation Ind. As S21 Cof 80,000 0 0 Ind. As COF 38,000 0 40-1 S29 C. 25.000 25,000 IN Ave 02. So Co 25,000 0 80.000 Supervisory Compensation 0%- 50 000 0%- 0% - 25.000 05 0 Projected Workforce Productivity Number of Workers Employed 5,000 800 0 0 3,479 150 5000 0 $000s 1330 5000 Spalis 201 03 0.00 1.12 200 Cost of Labor Associated wits Footwear Production 1000 5000 27472 3.720 2408 5201 3.799 480 1.200 1070 Sipar 5.16 0.83 OS 117 800 0.11 0.27 07 Production Base Wages Workers Incentive Pay Fringe Benefits Overtime Pay Total Best Practices Training Expenditures Supervisory Compensation Cat Punction har 0 0 0 pair 0.00 0.00 0.00 0.00 000 0.00 0.00 084 0 1933 21.434 080 72 0.00 000 0.00 0.00 0.10 for 0 0 0 COBRA Projected Y11 Performance 6 Investor Scoring Measures Year 11 Expectation EPS (eanings per share) $2.28 $2.50 ROE (return on equity) 19.6% 21.0% Credit Rating A- B+ Image Rating 64 70 Change Other Measures Year 11 from Y10 Net Revenues (9000) 448,270 +3.6% Net Profit (5000s) 45,686 +14.2% Ending Cash (8000) 53,937 +47,863 - This is the expectation WORKFORCE COMPENSATION & TRAINING Prior-Year Compensation and Productivity Data Workforce Base Wages Compensation Incentive Pay o per year Fringe Benefits Total Regular Compensation Overtime Pay Online Total Compensation Incentive Pay as a % of Regular Compensation Workforce Productivity in per her per year) North America Facility Industry Company Average F 34000 34.000 4.050 4,650 3.007 3.007 41,657 41,657 3,443 6.443 48.100 48,100 11.2% 11.296 5,000 5,000 Europe Africa Facility Industry Company Average F 20.400 2.790 1.800 24.900 0 24 990 11.2 0.0% 3.500 0 blooooo Asia-Pacific Facility Industry Company Average F 12.000 12,000 1573 1.573 5538 1536 15,100 15,109 3.391 3.301 18.500 18,500 10.4% 10.4% 3.500 3.500 Latin America Facility Industry Company Average F 12.000 1,574 1.500 15.074 0 15,074 10,4% 0.0% 3.500 olooooo . 12.000 05 0.00 0 - 2000 2000 34,340 0%- 1.00 4,650 $ 0.00 3000 3,000 O 41.990 6501 48,491 11.1% 0.0% S600 Purwoer ber Sup000 90 Sup000 olooooo 2.000 1% 12,120 OLO - 1,503 1500 - 1,536 15,219 3.420 18,639 10.3% 400- SHOP Rp 0,00 Compensation Base Wagehang hom pror year) and Training Incentive Pay per nonrededor of Production Workers Fringe Benefits per year) Total Regular Compensation Overtime Pay includes Total Compensation pery Incentive Pay as % of Regular Comp. Best Practices Training per we Materials Cost impact Supervisory Staff rate odcienwoners to Prior-Year Supervisory Compensation ennuperd) Supervisory Compensation Schwenyewe olo oleo 0.0% 0- Der D up 0.00 MODO 40 Sa=20 Co. BODO 60,000 0 000 60,000 0- indig 20000 Co. 40 Sof20 Co. 258 25,000 25.000 0% 25.000 Suo dag co 2000 0 25000 0% 0 0%. 0% 0 To be answered The requirement is to meet the Investor Expectation on the 1st page of EPS of $2.50, ROE of 21%, Credit rating of B+ or better, Image rating of 70, Net Revenue of +3.6%, Net Profit of +14.2%, Ending Cash Flow of +47,859. In this given slide I need to answer the Base Wage-10% to +15% for each facility, Incentive Pay between 0-8% for each facility, Fringe Benefits between 0-$8,000 for each facility, Best Practices training between 0-$7500 per worker for each facility for each facility between Supervisory Staff for each facility between 0-50 for each facility and the Supervisory Compensation between -15% and +15% for each facility
Step by Step Solution
There are 3 Steps involved in it

Get step-by-step solutions from verified subject matter experts