

Question: Prompt We will analyze the data to answer the second research question: Which of the drugs (if either) delayed the recurrence of depression longer relative
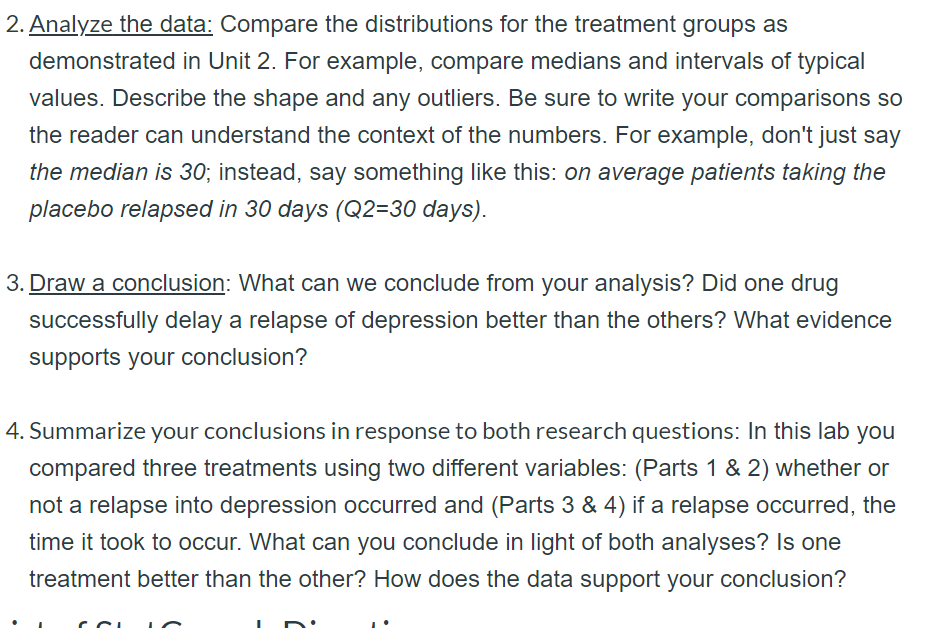
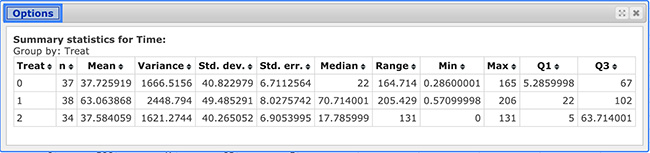
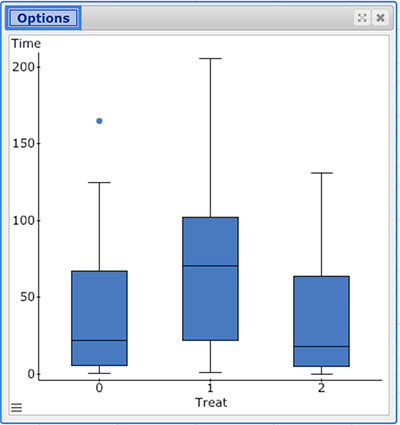
Prompt We will analyze the data to answer the second research question: Which of the drugs (if either) delayed the recurrence of depression longer relative to the placebo? In the previous lab-preparation activity, we identified Treat as the explanatory variable and Time as the response variable. We also determined that we will analyze the data using side-by-side boxplots and descriptive statistics (i.e. 5-number summaries since the graphs are boxplots). 1. Make graphs and tables. a. Use StatCrunch to produce side-by-side boxplots. (directions) Embed your graphs with your initial post. b. Use StatCrunch to produce the descriptive statistics (a table containing the 5- number summaries for each comparison group). (directions) Copy and paste the StatCrunch output table into your initial post. 2. Analyze the data: Compare the distributions for the treatment groups as demonstrated in Unit 2. For example, compare medians and intervals of typical values. Describe the shape and any outliers. Be sure to write your comparisons so the reader can understand the context of the numbers. For example, don't just say 2. Analyze the data: Compare the distributions for the treatment groups as demonstrated in Unit 2. For example, compare medians and intervals of typical values. Describe the shape and any outliers. Be sure to write your comparisons so the reader can understand the context of the numbers. For example, don't just say the median is 30; instead, say something like this: on average patients taking the placebo relapsed in 30 days (Q2=30 days). 3. Draw a conclusion: What can we conclude from your analysis? Did one drug successfully delay a relapse of depression better than the others? What evidence supports your conclusion? 4. Summarize your conclusions in response to both research questions: In this lab you compared three treatments using two different variables: (Parts 1 & 2) whether or not a relapse into depression occurred and (Parts 3 & 4) if a relapse occurred, the time it took to occur. What can you conclude in light of both analyses? Is one treatment better than the other? How does the data support your conclusion? Options Summary statistics for Time: Group by: Treat Treato no Mean Variance . Std. dev. Std. err. Mediane Range Min. Q1. Q3 0 37 37.725919 1666.5156 40.822979 6.7112564 22 164.714 0.28600001 165 5.2859998 67 1 38 63.063868 2448.794 49.485291 8.0275742 70.714001 205.429 0.57099998 206 22 102 2 34 37.584059 1621.2744 40.265052 6.9053995 17.785999 131 0 131 5 63.714001 50 X Options Time 200 150 100 50 0 Treat Prompt We will analyze the data to answer the second research question: Which of the drugs (if either) delayed the recurrence of depression longer relative to the placebo? In the previous lab-preparation activity, we identified Treat as the explanatory variable and Time as the response variable. We also determined that we will analyze the data using side-by-side boxplots and descriptive statistics (i.e. 5-number summaries since the graphs are boxplots). 1. Make graphs and tables. a. Use StatCrunch to produce side-by-side boxplots. (directions) Embed your graphs with your initial post. b. Use StatCrunch to produce the descriptive statistics (a table containing the 5- number summaries for each comparison group). (directions) Copy and paste the StatCrunch output table into your initial post. 2. Analyze the data: Compare the distributions for the treatment groups as demonstrated in Unit 2. For example, compare medians and intervals of typical values. Describe the shape and any outliers. Be sure to write your comparisons so the reader can understand the context of the numbers. For example, don't just say 2. Analyze the data: Compare the distributions for the treatment groups as demonstrated in Unit 2. For example, compare medians and intervals of typical values. Describe the shape and any outliers. Be sure to write your comparisons so the reader can understand the context of the numbers. For example, don't just say the median is 30; instead, say something like this: on average patients taking the placebo relapsed in 30 days (Q2=30 days). 3. Draw a conclusion: What can we conclude from your analysis? Did one drug successfully delay a relapse of depression better than the others? What evidence supports your conclusion? 4. Summarize your conclusions in response to both research questions: In this lab you compared three treatments using two different variables: (Parts 1 & 2) whether or not a relapse into depression occurred and (Parts 3 & 4) if a relapse occurred, the time it took to occur. What can you conclude in light of both analyses? Is one treatment better than the other? How does the data support your conclusion? Options Summary statistics for Time: Group by: Treat Treato no Mean Variance . Std. dev. Std. err. Mediane Range Min. Q1. Q3 0 37 37.725919 1666.5156 40.822979 6.7112564 22 164.714 0.28600001 165 5.2859998 67 1 38 63.063868 2448.794 49.485291 8.0275742 70.714001 205.429 0.57099998 206 22 102 2 34 37.584059 1621.2744 40.265052 6.9053995 17.785999 131 0 131 5 63.714001 50 X Options Time 200 150 100 50 0 Treat
Step by Step Solution
There are 3 Steps involved in it
1 Expert Approved Answer
Step: 1 Unlock

Question Has Been Solved by an Expert!
Get step-by-step solutions from verified subject matter experts
Step: 2 Unlock
Step: 3 Unlock