

Question: Prompt Your team has been given various data sets in order to analyze information and summarize the findings. These are in the form of simple
Prompt
Your team has been given various data sets in order to analyze information and summarize the findings. These are in the form of simple return merchandise authorizations, or RMAs. Your task is to write brief summaries that capture the results of the analysis to present to the product manager, who may or may not have a technical background. This is why you should write the summaries for an audience of nontechnical stakeholders.
Write a detailed summary of your analysis of the bulleted items below. Prepare your summary for nontechnical stakeholders. Use the list below to guide the structure and organization of your report.
- Write SQL commands that capture specific, usable data that can be used in your analysis.
- Analyze the results of queries to identify specific information that can be presented in your summary.
- Sales by region:
- Analyze sales by state to determine where the company has the largest customer base.
- Analyze the data to determine the top three products sold in the United States.
- Analyze the data to determine the top three products sold in the southeastern region of the United States.
- Southeastern states to include in your analysis: Virginia, North Carolina, South Carolina, and Georgia
- Returns by region:
- Analyze the data to determine the top three products returned in the United States.
- Analyze the data to determine the top three products returned in the northwestern region of the United States.
- Northwestern states to include in your analysis: Washington, Oregon, Idaho, and Montana
- Sales by region:
- Write an effective summary of the analysis of the captured data.
- Sales by region:
- Provide a well-written summary of your analysis on parts A through C.
- Returns by region:
- Provide a well-written summary of your analysis on parts A and B.
- Sales by region:
- Clearly communicate your findings to the Quantigration product manager by writing a report that explains your findings in a way nontechnical stakeholders will be able to digest and use.
Need Help with 1C AND 2B Only!
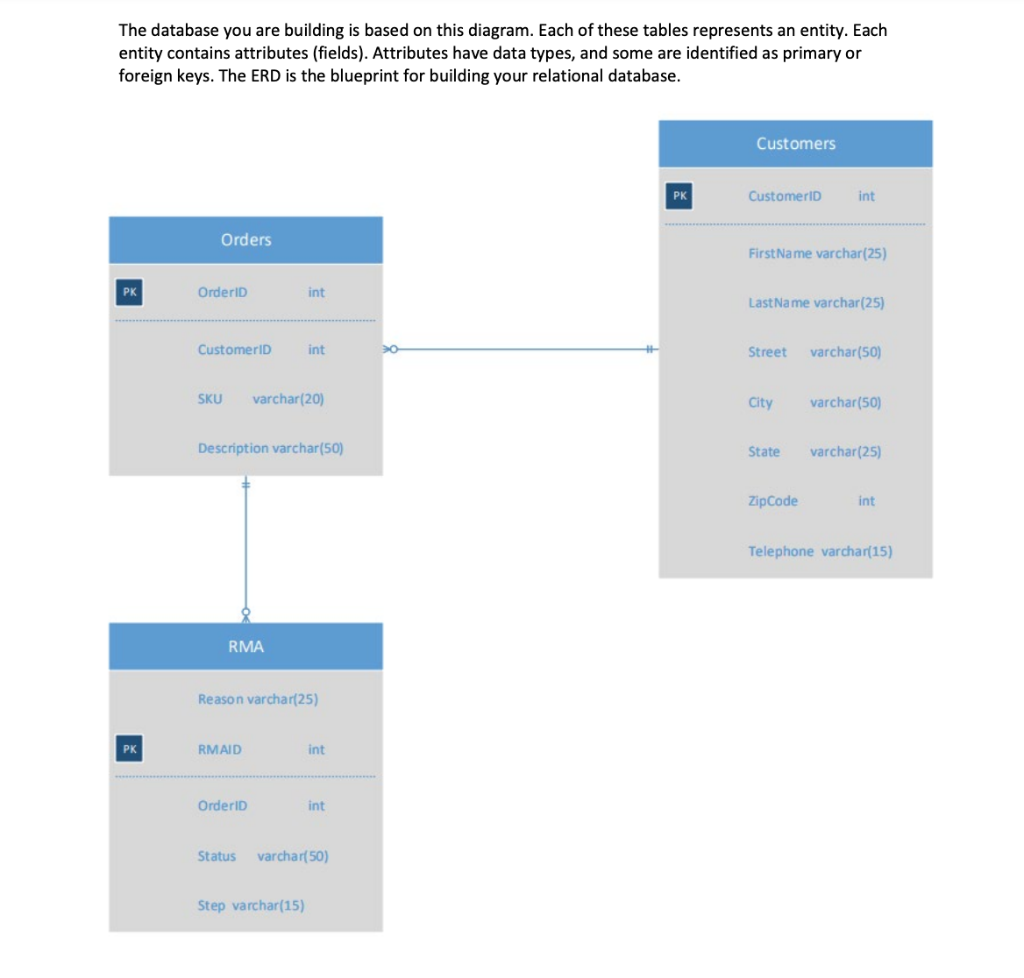
The database you are building is based on this diagram. Each of these tables represents an entity. Each entity contains attributes (fields). Attributes have data types, and some are identified as primary or foreign keys. The ERD is the blueprint for building your relational database. Customers Customer int Orders First Name varchar(25) OrderiD i nt Last Name varchar(25) CustomerID Street varchar(50) SKU varchar(20) City varchar(50) Description varchar(50) State varchar(25) ZipCode int Telephone varchar(15) RMA Reason varchar(25) RMAID OrderID Status varchar(50) Step varchar(15) The database you are building is based on this diagram. Each of these tables represents an entity. Each entity contains attributes (fields). Attributes have data types, and some are identified as primary or foreign keys. The ERD is the blueprint for building your relational database. Customers Customer int Orders First Name varchar(25) OrderiD i nt Last Name varchar(25) CustomerID Street varchar(50) SKU varchar(20) City varchar(50) Description varchar(50) State varchar(25) ZipCode int Telephone varchar(15) RMA Reason varchar(25) RMAID OrderID Status varchar(50) Step varchar(15)
Step by Step Solution
There are 3 Steps involved in it

Get step-by-step solutions from verified subject matter experts