

Question: Propose a hypothesis with the given data below Table 2: Two-sample t tests for Difference in Means AAER - 0 AAER - 1 p-value ROA

Propose a hypothesis with the given data below
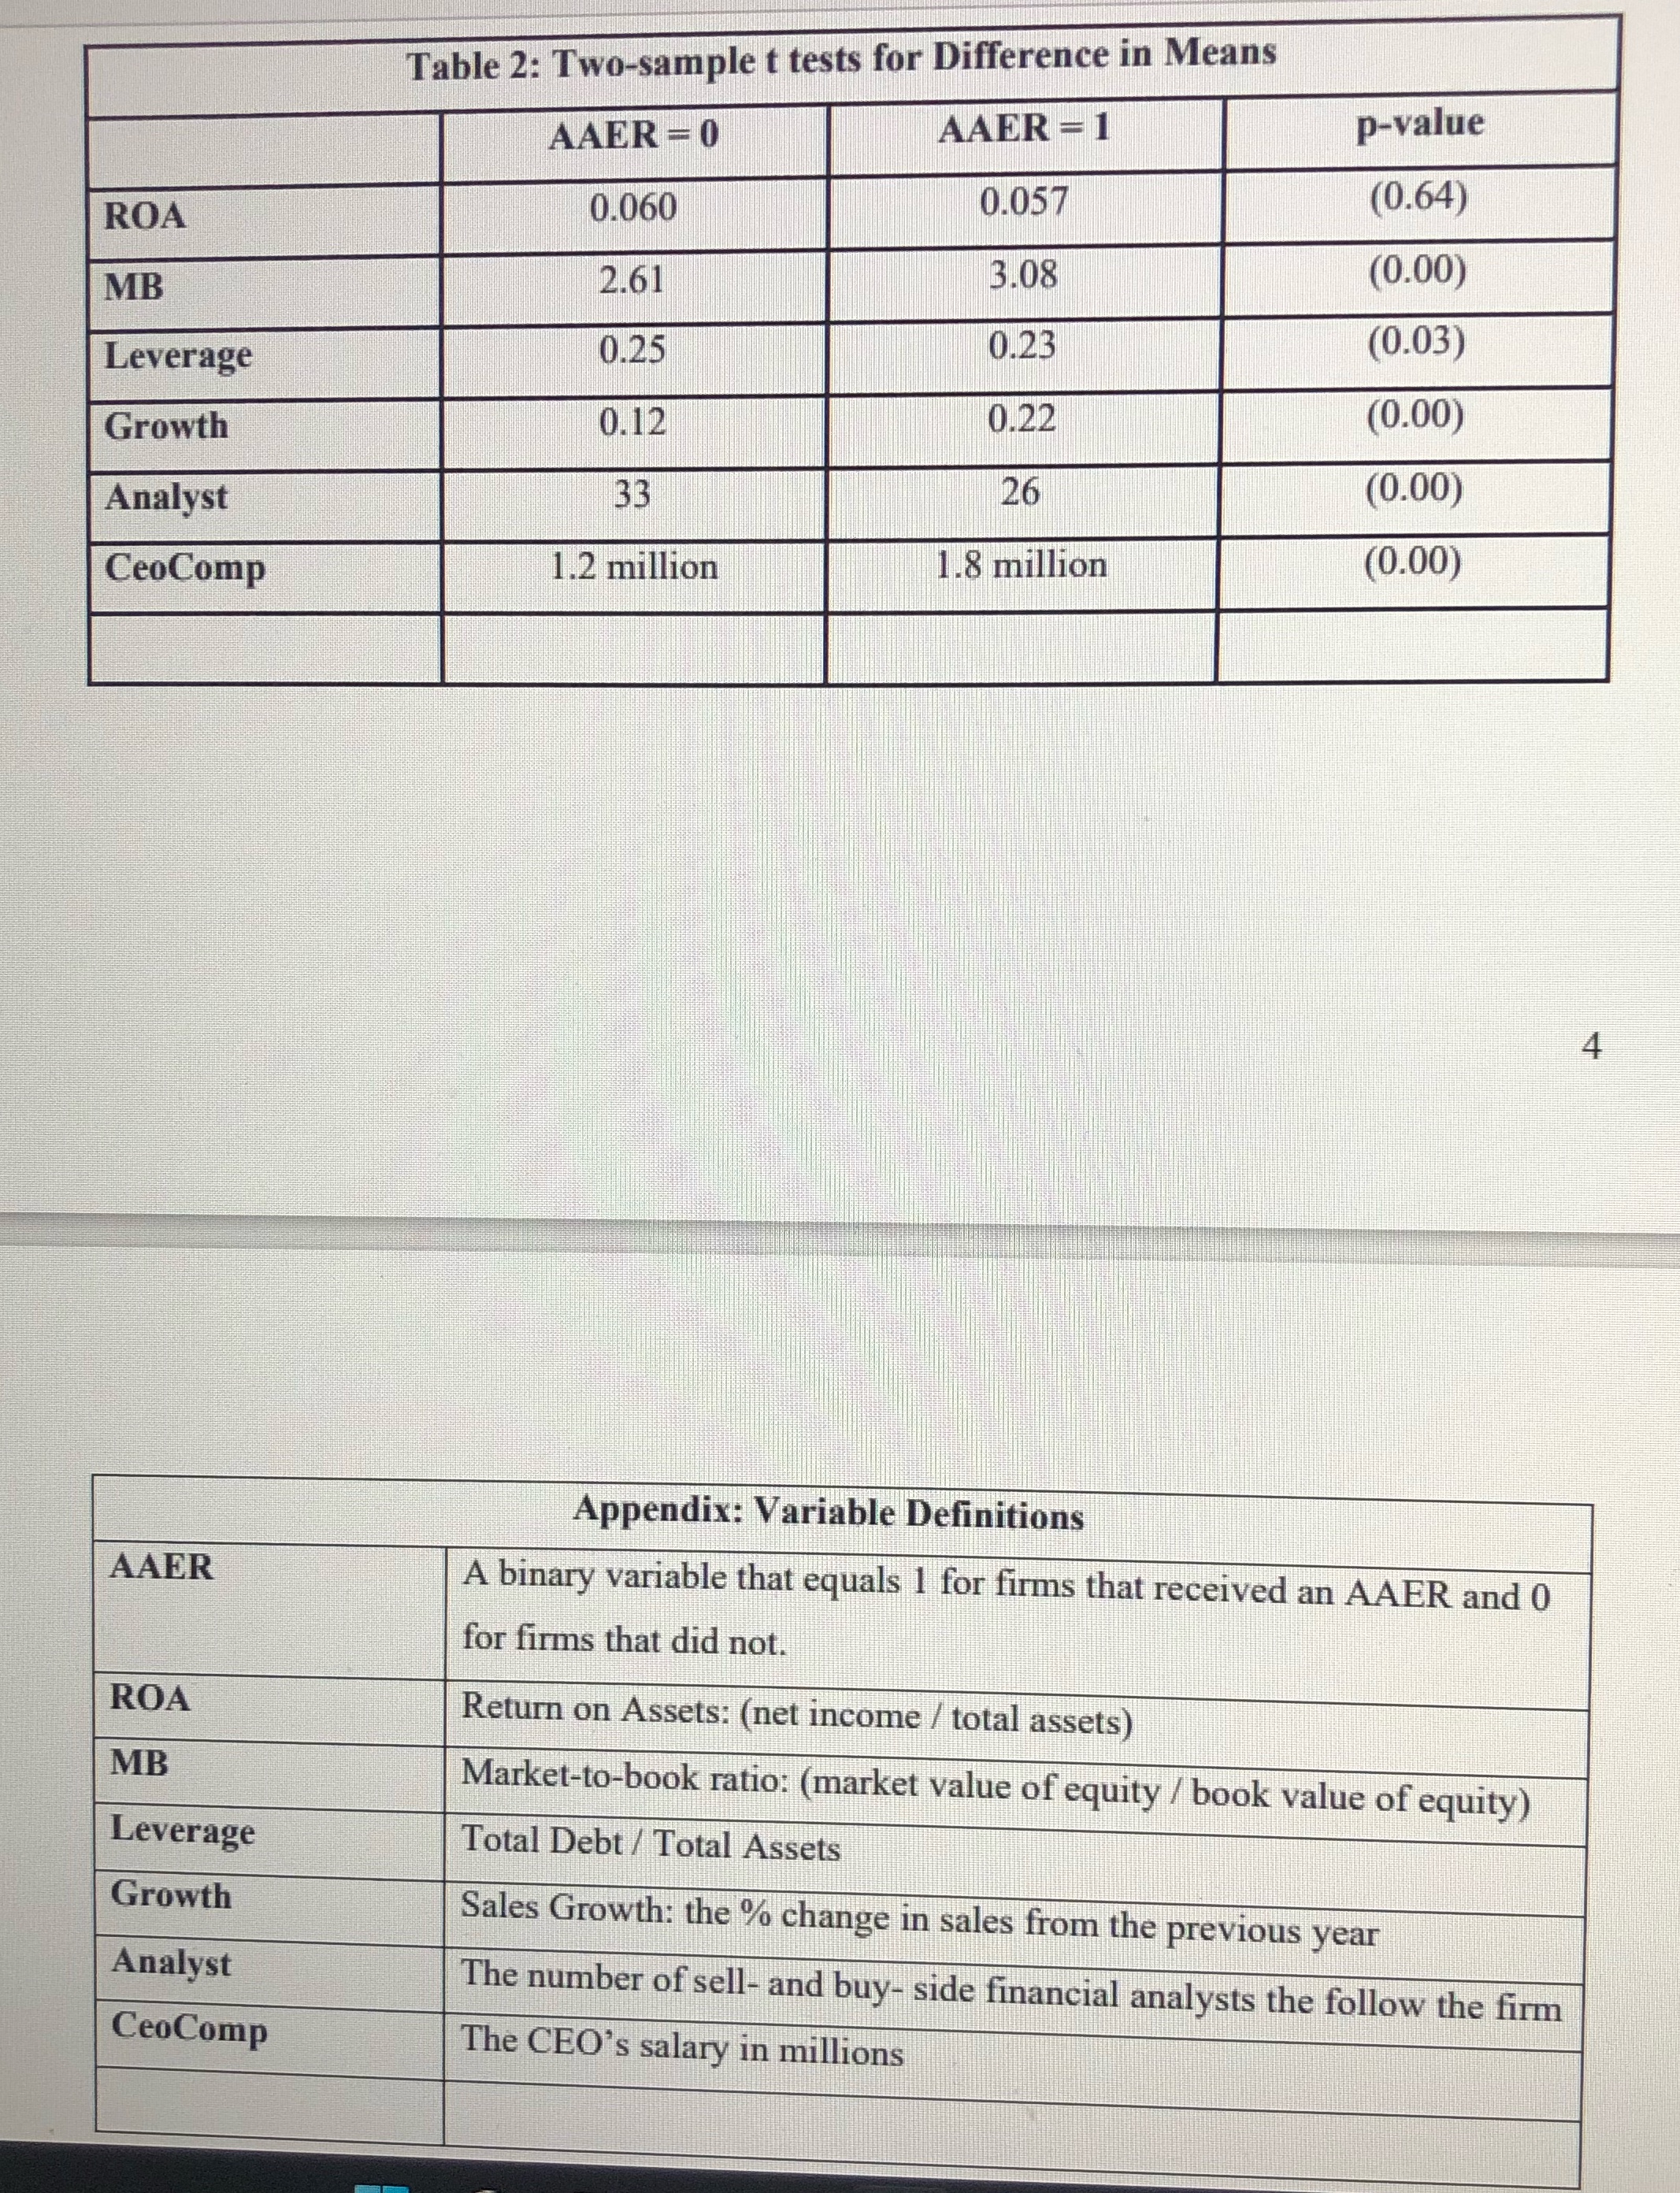
Table 2: Two-sample t tests for Difference in Means AAER - 0 AAER - 1 p-value ROA 0.060 0.057 (0.64) MB 2.61 3.08 (0.00) Leverage 0.25 0.23 (0.03) Growth 0.12 0.22 (0.00) Analyst 33 26 (0.00) CeoComp 1.2 million 1.8 million (0.00) Appendix: Variable Definitions AAER A binary variable that equals 1 for firms that received an AAER and 0 for firms that did not. ROA Return on Assets: (net income / total assets) MB Market-to-book ratio: (market value of equity / book value of equity) Leverage Total Debt / Total Assets Growth Sales Growth: the % change in sales from the previous year Analyst The number of sell- and buy- side financial analysts the follow the firm CeoComp The CEO's salary in millions
Step by Step Solution
There are 3 Steps involved in it

Get step-by-step solutions from verified subject matter experts