

Question: Propose a null and research hypothesis, explain why you have enough evidence to reject the null hypothesis, and interpret the results of each chi square
Propose a null and research hypothesis, explain why you have enough evidence to reject the null hypothesis, and interpret the results of each chi square testIdentify the most appropriate measure of association (may be more than one)
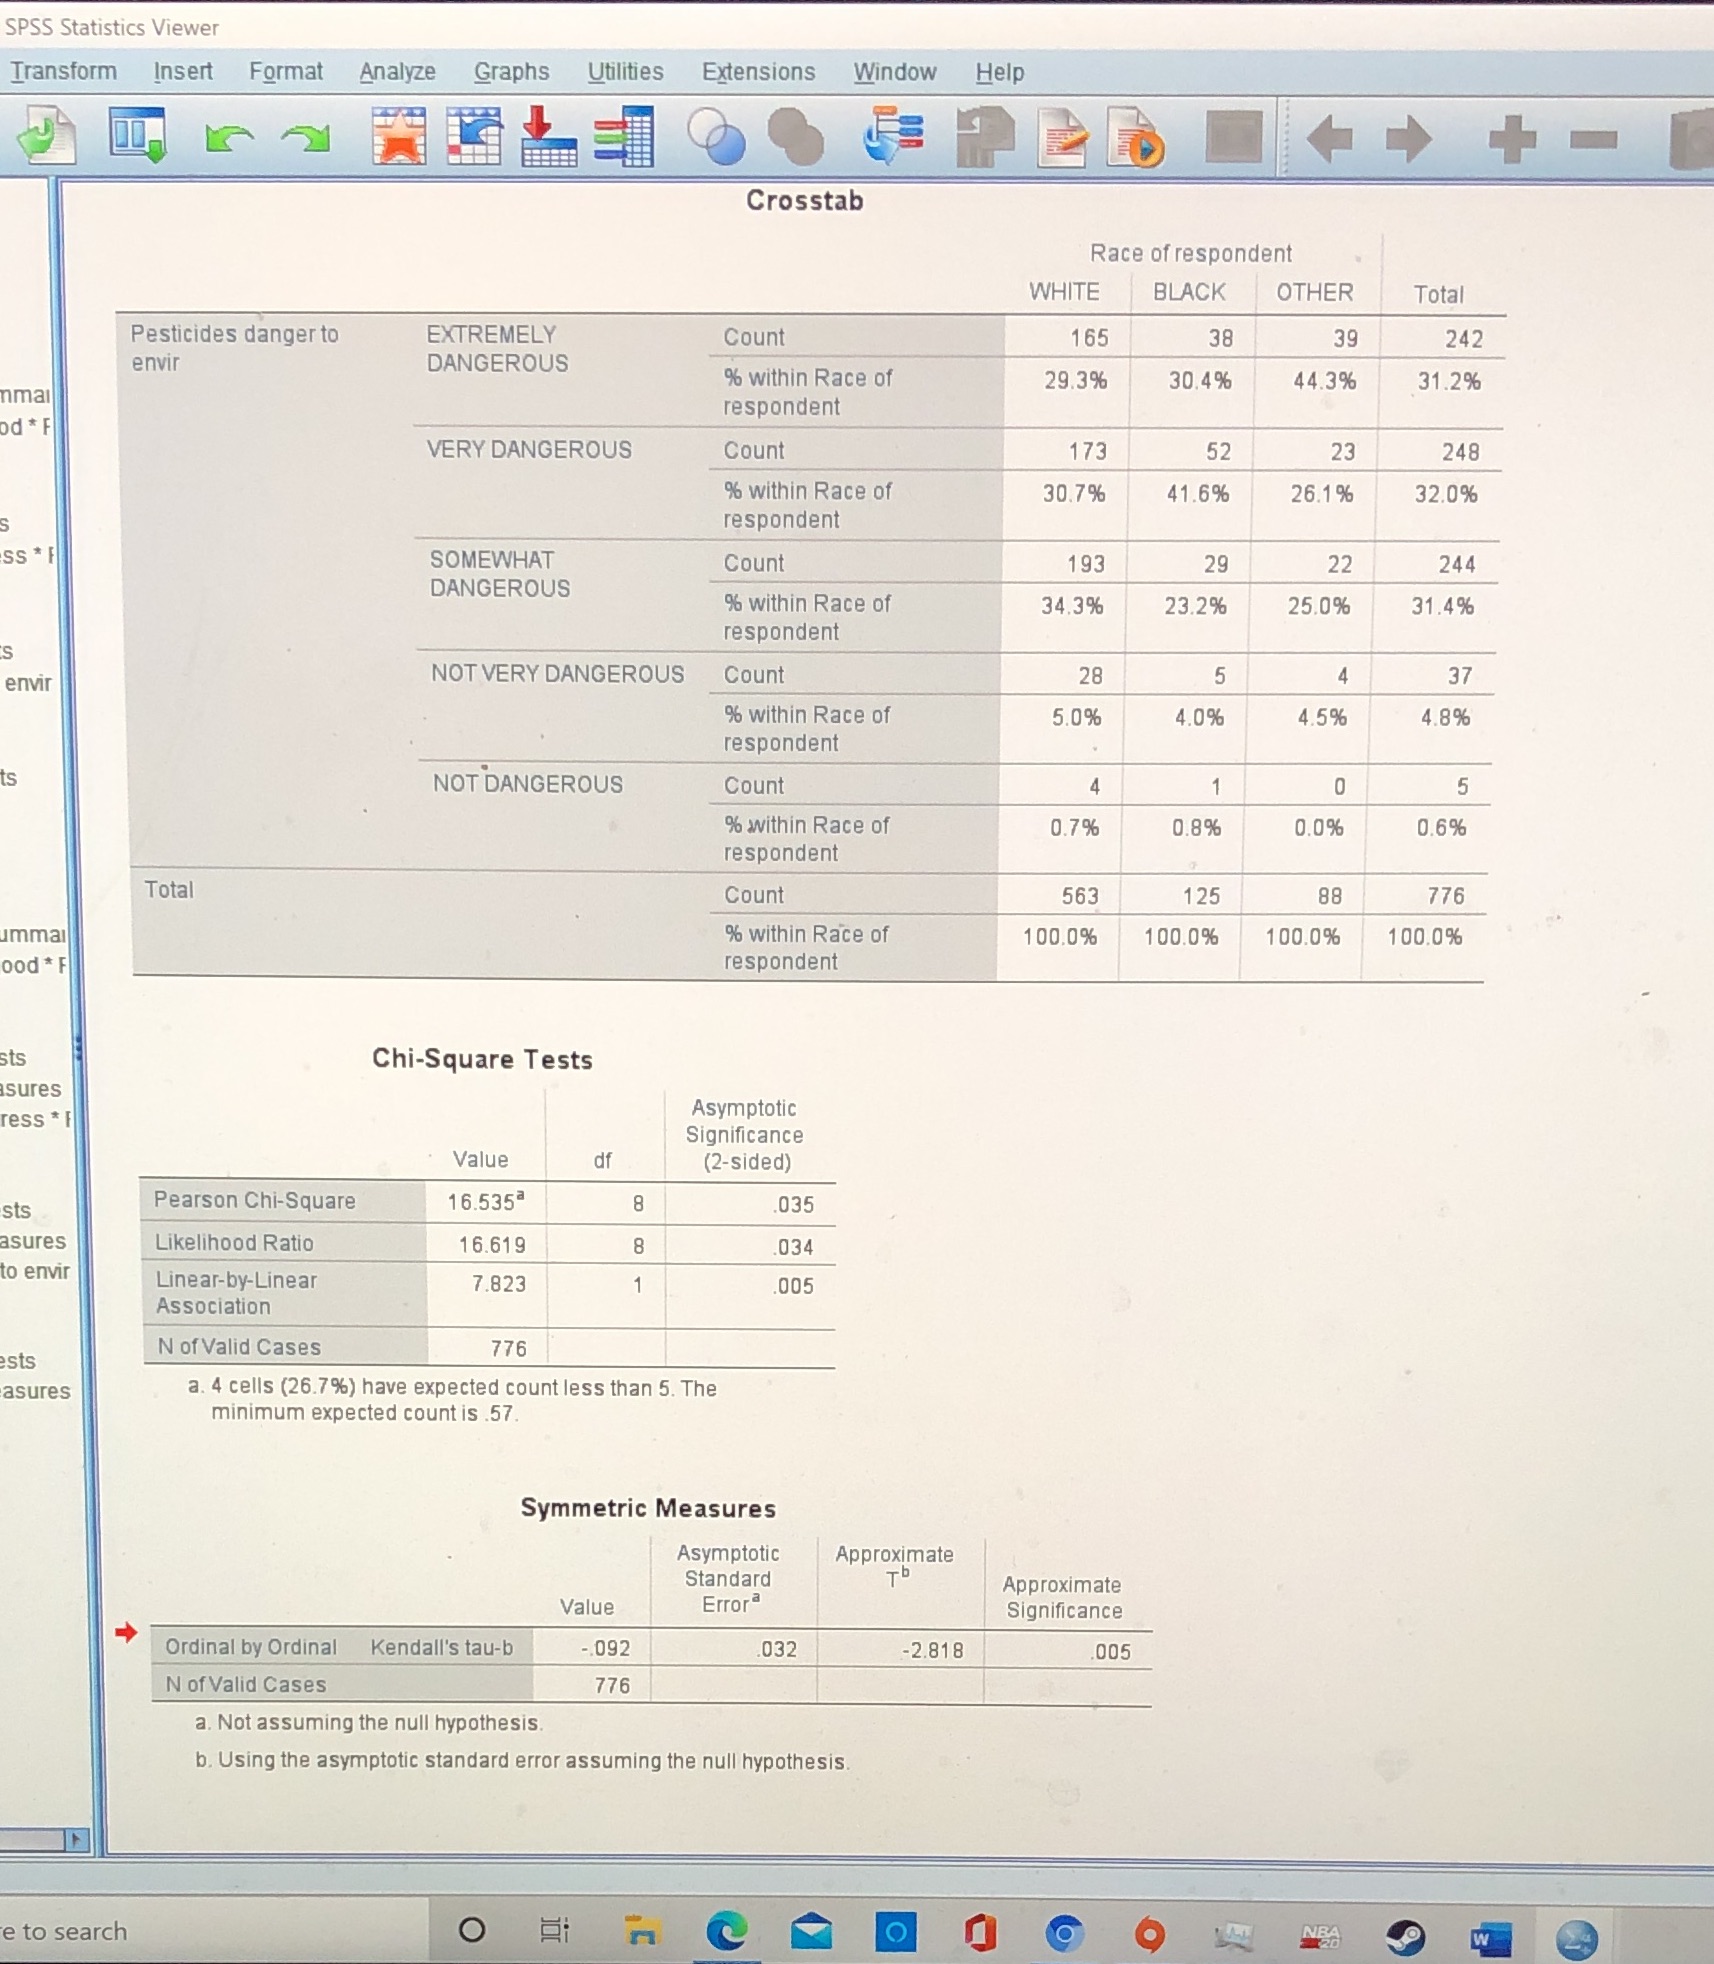
SPSS Statistics Viewer Transform Insert Format Analyze Graphs Utilities Extensions Window Help Crosstab Race of respondent WHITE BLACK OTHER Total Pesticides danger to EXTREMELY Count 165 38 39 242 envir DANGEROUS % within Race of 29.3% 30.4% 44.3% 31.2% nmal respondent d * F VERY DANGEROUS Coun 173 52 23 248 % within Race of 30.7% 41.6% 26.1% 32.0% respondent SS * SOMEWHAT Count 193 29 22 244 DANGEROUS % within Race of 34.3% 23.2% 25.0% 31.4% respondent 28 37 envir NOT VERY DANGEROUS Coun % within Race of 6.0 9% 4.0% 4.5% 4.8% respondent NOT DANGEROUS Count 0 % within Race of 0.7% 0.8% 0.0% 0.6% respondent Total Count 563 125 88 776 ummal % within Race of 100.0% 100.0% 100.0% 100.0% ood * F respondent IS Chi-Square Tests sures Asymptotic ress * [ Significance Value (2-sided) Pearson Chi-Square 16.535 8 .035 asures Likelihood Ratio 16.619 8 034 o envir Linear-by-Linear 7.823 005 Association N of Valid Cases 776 SIS asures a. 4 cells (26.7%) have expected count less than 5. The minimum expected count is .57. Symmetric Measures Asymptotic Approximate Standard Tb Approximate Value Error Significance Ordinal by Ordinal Kendall's tau-b .092 032 -2.818 005 N of Valid Cases 776 a. Not assuming the null hypothesis. b. Using the asymptotic standard error assuming the null hypothesis. e to search O Eli NBA W
Step by Step Solution
There are 3 Steps involved in it

Get step-by-step solutions from verified subject matter experts