

Question: Propose a null and research hypothesis, explain why you have enough evidence to reject the null hypothesis, and interpret the results of each chi square
Propose a null and research hypothesis, explain why you have enough evidence to reject the null hypothesis, and interpret the results of each chi square testIdentify the most appropriate measure of association (may be more than one)
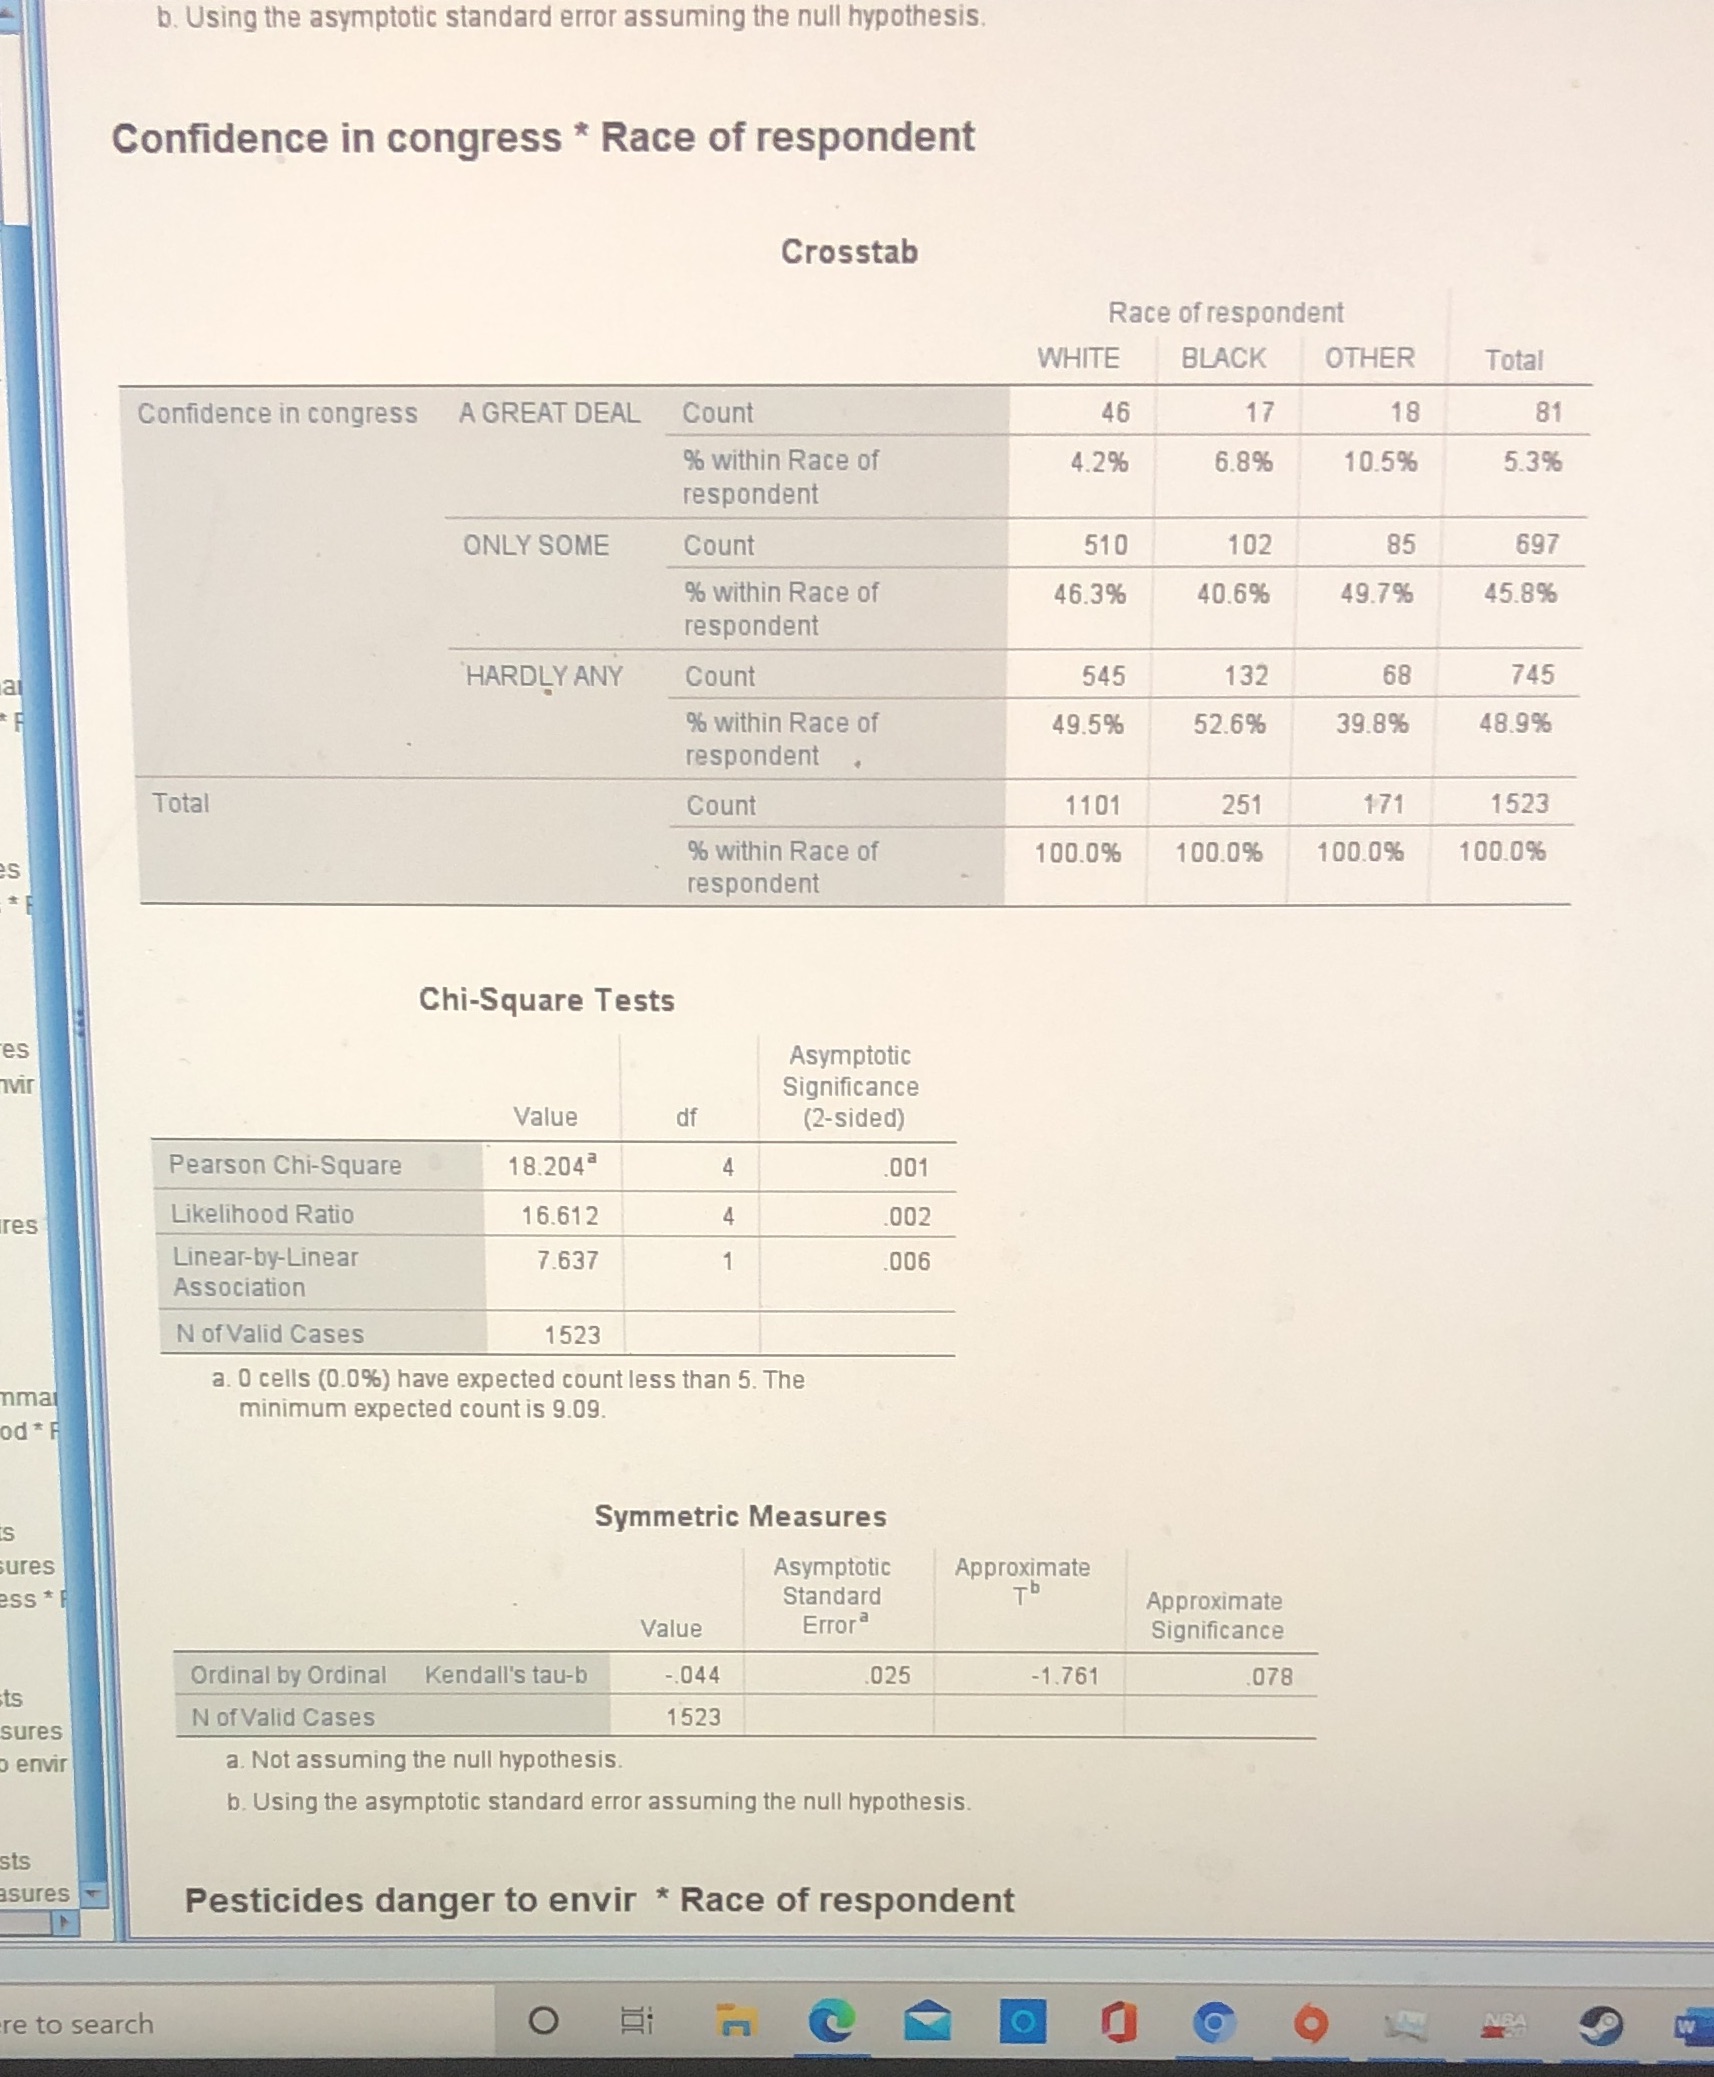
b. Using the asymptotic standard error assuming the null hypothesis. Confidence in congress * Race of respondent Crosstab Race of respondent WHITE BLACK OTHER Total Confidence in congress A GREAT DEAL Count 46 17 18 81 % within Race of 4.2% 6.8% 10.5% 5.3% respondent ONLY SOME Count 510 102 85 697 % within Race of 46.3% 40.6% 49.7% 45.8% respondent HARDLY ANY Count 545 132 68 745 % within Race of 49.5% 52.6% 39.8% 48.9% respondent Total Count 1101 251 171 1523 % within Race of 100.0% 100.0% 100.0% 100.0% respondent Chi-Square Tests es Asymptotic Significance Value df (2-sided) Pearson Chi-Square 18.204 4 001 res Likelihood Ratio 16.612 4 002 Linear-by-Linear 7.637 006 Association of Valid Cases 1523 a. 0 cells (0.0%) have expected count less than 5. The ma minimum expected count is 9.09. d = Symmetric Measures sures Asymptotic Approximate ess Standard Th Approximate Value Error Significance Ordinal by Ordinal Kendall's tau-b .044 025 -1.761 078 sures N of Valid Cases 1523 envir a. Not assuming the null hypothesis b. Using the asymptotic standard error assuming the null hypothesis. sts asures Pesticides danger to envir * Race of respondent re to search O
Step by Step Solution
There are 3 Steps involved in it

Get step-by-step solutions from verified subject matter experts