

Question: Provide a graph of Prob. # 8 . 2 0 textbook solution results by plotting a curve or a series of cycles of crash in
Provide a graph of Prob. # textbook solution results by plotting a curve or a series of cycles
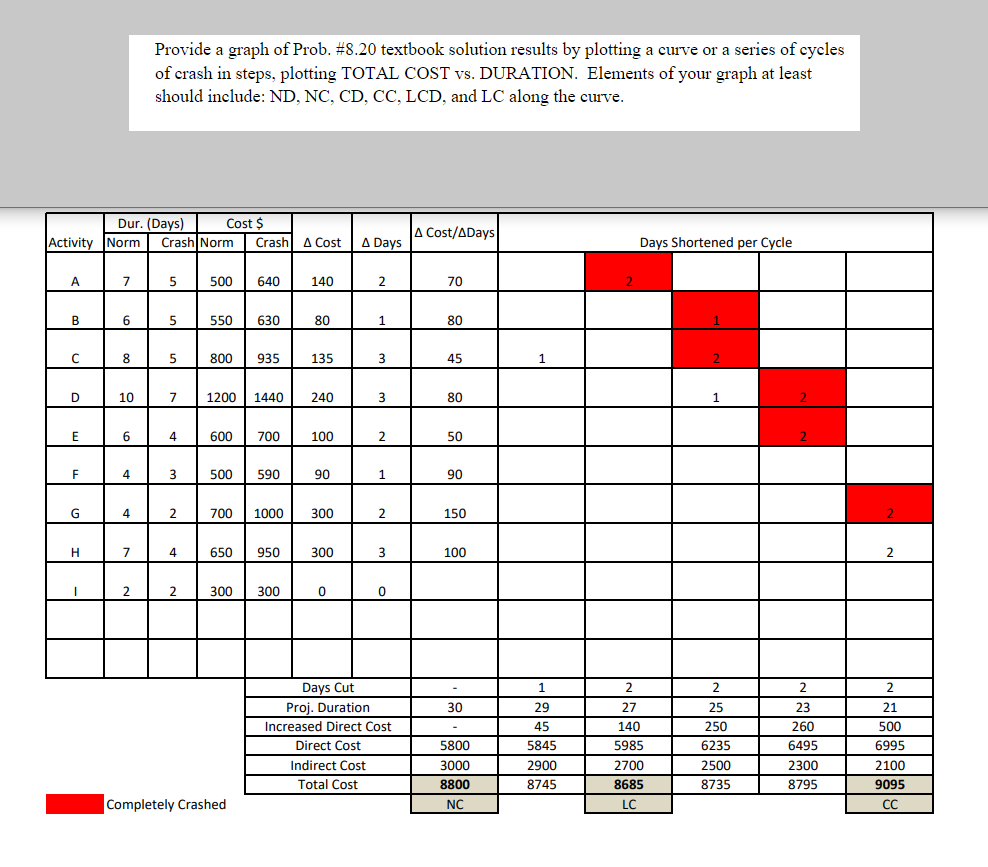
of crash in steps, plotting TOTAL COST vs DURATION. Elements of your graph at least
should include: ND NC CD CC LCD, and LC along the curve.Provide a graph of Prob. # textbook solution results by plotting a curve or a series of cycles of crash in steps, plotting TOTAL COST vs DURATION. Elements of your graph at least should include: ND NC CD CC LCD, and LC along the curve.
tableActivityDur. DaysCost $ Cost, Days, Cost Days,Days Shortened per CycleNormCrash,Norm,CrashABDEGDays Cut,Proj. Duration,Increased Direct Cost,Direct Cost,Indirect Cost,Total Cost,Completely Crashed,,,,LCCC
Step by Step Solution
There are 3 Steps involved in it
1 Expert Approved Answer
Step: 1 Unlock

Question Has Been Solved by an Expert!
Get step-by-step solutions from verified subject matter experts
Step: 2 Unlock
Step: 3 Unlock