

Question: provide answer for above ques take help from solved example Calculate the 95% prediction intervals for the four different investments included in the following table.
 provide answer for above ques
take help from solved example
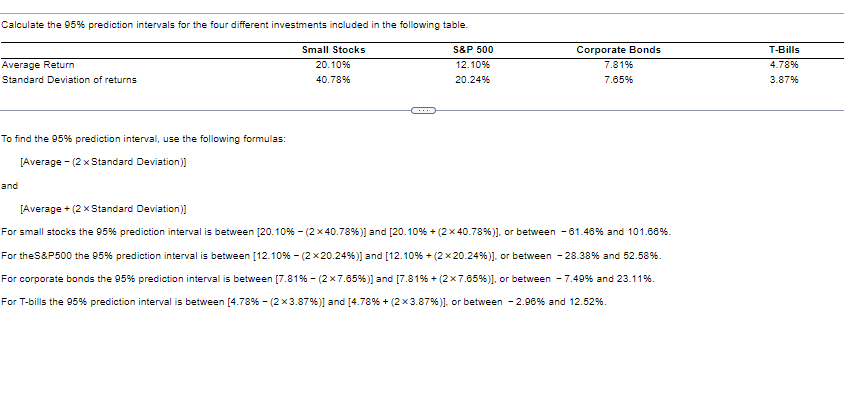
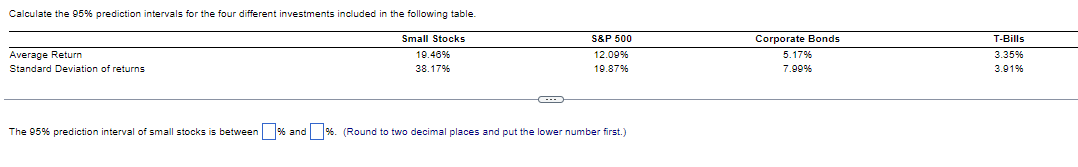
Calculate the 95% prediction intervals for the four different investments included in the following table. The 95% prediction interval of small stocks is between % and 6. (Round to two decimal places and put the lower number first.) Calculate the 95% prediction intervals for the four different investments included in the following table. To find the 95% prediction interval, use the following formulas: [Average (2 Standard Deviation )] and [Average +(2 Standard Deviation )] For small stocks the 95% prediction interval is between [20.10%(240.78%)] and [20.10%+(240.78%)], or between 61.46% and 101.66%. For corporate bonds the 95% prediction interval is between [7.81%(27.65%)] and [7.81%+(27.65%)], or between 7.49% and 23.11%. For T-bills the 95% prediction interval is between [4.78%(23.87%)] and [4.78%+(23.87%)], or between 2.96% and 12.52%
Step by Step Solution
There are 3 Steps involved in it

Get step-by-step solutions from verified subject matter experts