

Question: Provide clean and clear solutions. Don't use excel for computations. Thank you. Take your time to answer. The formula is already given 2. A random
Provide clean and clear solutions. Don't use excel for computations. Thank you. Take your time to answer. The formula is already given
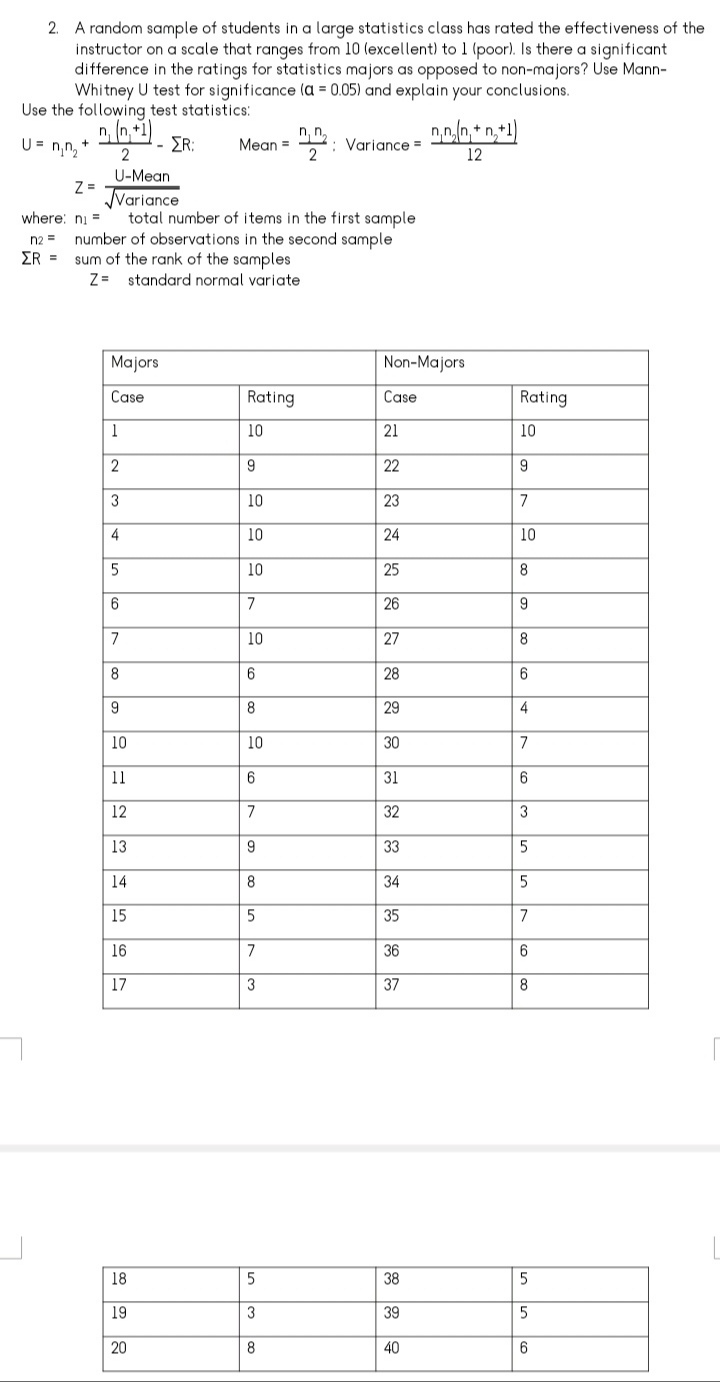
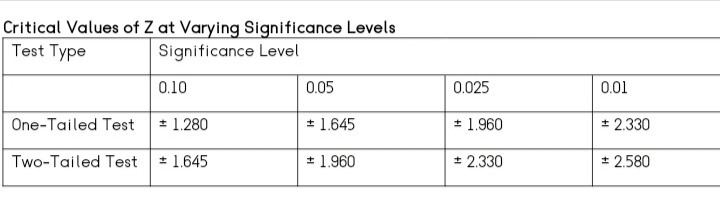
2. A random sample of students in a large statistics class has rated the effectiveness of the instructor on a scale that ranges from 10 (excellent) to 1 (poor). Is there a significant difference in the ratings for statistics majors as opposed to non-majors? Use Mann- Whitney U test for significance (a = 0.05) and explain your conclusions. Use the following test statistics: U = nn, + Mean = -2: Variance = min,( + n,+1) 2 ER: 12 U-Mean Z = Variance where: ni = total number of items in the first sample n2 = number of observations in the second sample ER = sum of the rank of the samples Z= standard normal variate Majors Non-Majors Case Rating Case Rating 1 10 21 10 2 9 22 9 3 10 23 7 4 10 24 10 5 10 25 8 6 7 26 9 7 10 27 8 8 6 28 6 9 8 29 10 10 30 11 6 31 6 12 32 3 13 9 33 14 8 34 5 15 5 35 7 16 7 36 6 17 3 37 8 18 38 19 3 39 20 8 40 6Critical Values of Z at Varying Significance Levels Test Type Significance Level 0.10 0.05 0.025 0.01 One-Tailed Test # 1.280 # 1.645 1.960 + 2.330 Two-Tailed Test $ 1.645 # 1.960 $ 2.330 $ 2.580
Step by Step Solution
There are 3 Steps involved in it

Get step-by-step solutions from verified subject matter experts