

Question: PROVIDE: IPO CHART SOLUTION ALGORITHM MATLAB CODE. 1.1 The demand estimation is the starting point for planning the future electric power supply. The consistency of
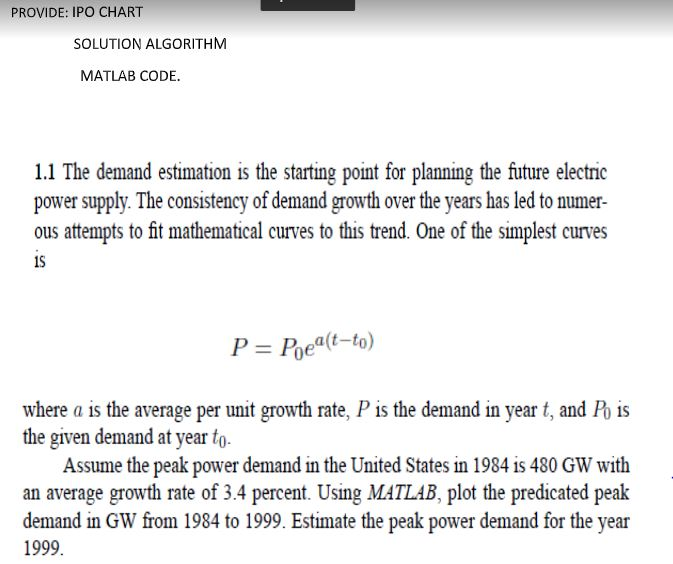
PROVIDE: IPO CHART SOLUTION ALGORITHM MATLAB CODE. 1.1 The demand estimation is the starting point for planning the future electric power supply. The consistency of demand growth over the years has led to numer- ous attempts to fit mathematical curves to this trend. One of the simplest curves 1S P Poealt-to) where a is the average per unit growth rate, P is the demand in year t, and Po is the given demand at year to- Assume the peak power demand in the United States in 1984 is 480 GW with an average growth rate of 3.4 percent. Using MATLAB, plot the predicated peak demand in GW from 1984 to 1999. Estimate the peak power demand for the year 1999 PROVIDE: IPO CHART SOLUTION ALGORITHM MATLAB CODE. 1.1 The demand estimation is the starting point for planning the future electric power supply. The consistency of demand growth over the years has led to numer- ous attempts to fit mathematical curves to this trend. One of the simplest curves 1S P Poealt-to) where a is the average per unit growth rate, P is the demand in year t, and Po is the given demand at year to- Assume the peak power demand in the United States in 1984 is 480 GW with an average growth rate of 3.4 percent. Using MATLAB, plot the predicated peak demand in GW from 1984 to 1999. Estimate the peak power demand for the year 1999
Step by Step Solution
There are 3 Steps involved in it

Get step-by-step solutions from verified subject matter experts