

Question: Provide the forecast from penods 2 through 12 using the naive approach (enter your responses as whole numbers) begin{tabular}{llllllllllll} hline Year & 2 & 3
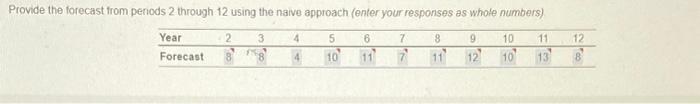
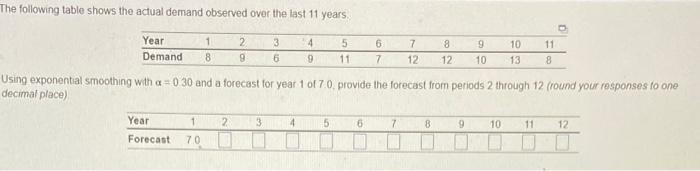
Provide the forecast from penods 2 through 12 using the naive approach (enter your responses as whole numbers) \begin{tabular}{llllllllllll} \hline Year & 2 & 3 & 4 & 5 & 6 & 7 & 8 & 9 & 10 & 11 & 12 \\ \hline Forecast & 8 & F & 4 & 10 & 11 & 7 & 11 & 12 & 10 & 13 & 8 \\ \hline \end{tabular} The following table shows the actual demand observed over the last 11 years. Using exponential smoothing with =0.30 and a forecast for year 1 of 7.0, provide. the forecast from periods 2 through 12 (round) decimal place)
Step by Step Solution
There are 3 Steps involved in it
1 Expert Approved Answer
Step: 1 Unlock

Question Has Been Solved by an Expert!
Get step-by-step solutions from verified subject matter experts
Step: 2 Unlock
Step: 3 Unlock