Question: provide the forecast from periods two through 12 using the nave approach. based on the pictures, the first chart shows the actual demand observed over

provide the forecast from periods two through 12 using the nave approach. provide the forecast from periods two through 12
provide the forecast from periods two through 12
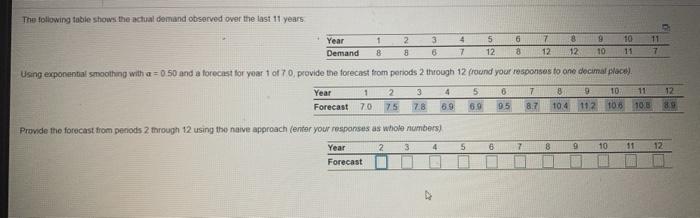
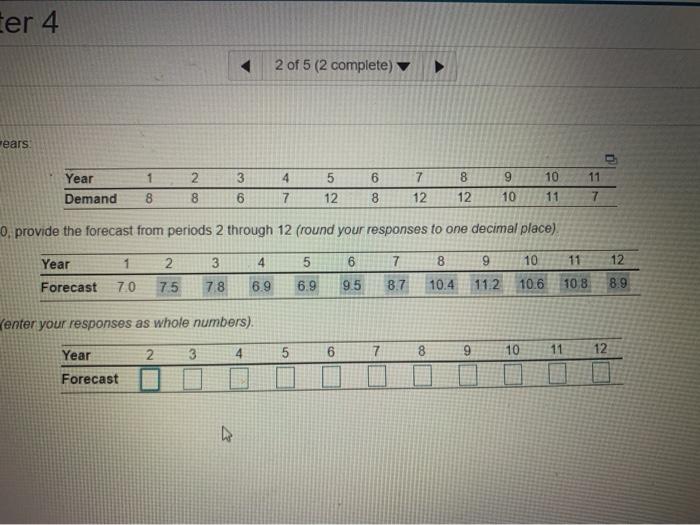
based on the pictures, the first chart shows the actual demand observed over the last 11 years. The second chart was created by doing the exponential smoothing.
The following table shows the actual demand observed over the last 11 years Year 1 2. 3 4 5 6 7 8 9 10 11 Demand 8 8 6 7 12 8 12 12 10 11 7 Using exponential smoothing with a = 0.50 and a forecast for yoar 1 of 70 provide the forecast from periods 2 through 12 (round your responses to one decimal place) Year 1 2 3 5 6 7 8 9 10 11 12 Forecast 70 75 69 9.5 8.7 104 112 108 108 89 Provide the forecast from penods 2 through 12 using the naive approach (enfor your responses as whole numbers) 2 3 4 5 6 7 8 9 10 11 12 Year Forecast ter 4 2 of 5 (2 complete) ears 1 2 5 6 8 9 11 Year Demand 3 6 4 7 7 12 10 11 8 8 12 8 12 10 7 0. provide the forecast from periods 2 through 12 (round responses to one decimal place) Year 1 3 4 6 7 8 9 10 12 2 75 5 6.9 11 108 Forecast 70 78 6.9 95 8.7 10.4 112 10.6 8.9 (enter your responses as whole numbers) Year 4 5 6 7 8 8 9 10 11 12 2 3 Forecast I DE

Step by Step Solution

There are 3 Steps involved in it

1 Expert Approved Answer
Step: 1 Unlock blur-text-image
Question Has Been Solved by an Expert!

Get step-by-step solutions from verified subject matter experts

Step: 2 Unlock
Step: 3 Unlock

Students Have Also Explored These Related General Management Questions!