

Question: Provided is the Exhibit 10-4 and segment margin for Centex Yarns Polyester Fibers Division Nylon Fibers Division Rope Division S 6,725,000 Total Revenue $10,600,000 $
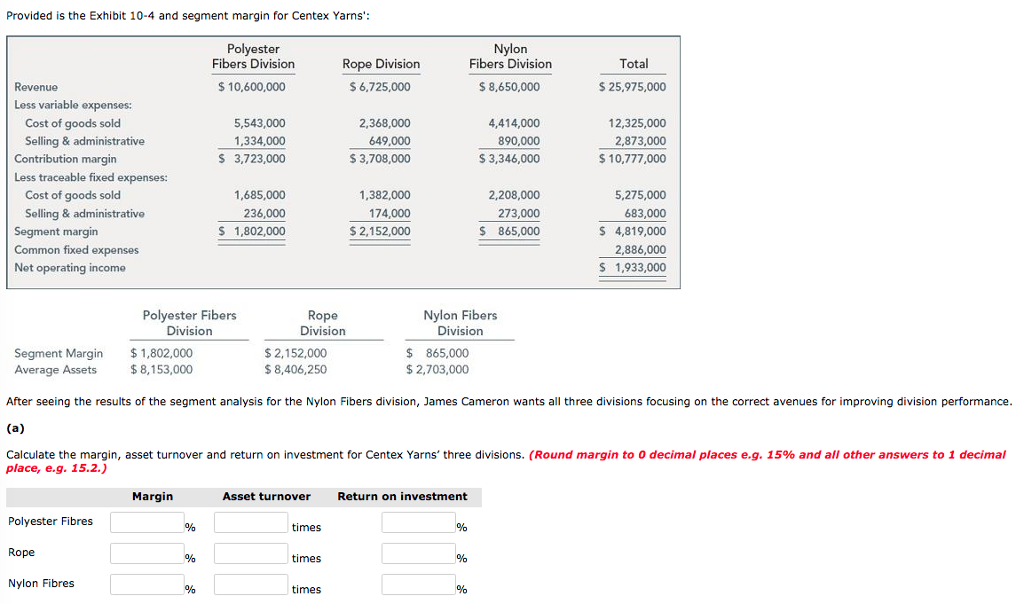
Provided is the Exhibit 10-4 and segment margin for Centex Yarns Polyester Fibers Division Nylon Fibers Division Rope Division S 6,725,000 Total Revenue $10,600,000 $ 8,650,000 S 25,975,000 Less variable expenses: 5,543,000 1,334,000 2,368,000 649,000 S 3,708,000 Cost of goods sold Selling & administrative Contribution margin Less traceable fixed expenses: 4,414,000 890,000 S 3,346,000 12,325,000 2,873,000 10,777,000 s 3,723,000 1,685,000 236,000 S 1,802,000 1,382,000 174,000 $ 2,152,000 2,208,000 273,000 S 865,000 5,275,000 683,000 S 4,819,000 2,886,000 S 1,933,000 Cost of goods sold Solling & administrativo Segment margin Common fixed expenses Net operating income Polyester Fibers Division Rope Division Nylon Fibers Divisionn Segment Margin 1,802,000 Average Assets 8,1 $ 2,152,000 $ 8,406,250 $ 865,000 $ 2,703,000 $ 8,153,000 After seeing the results of the segment analysis for the Nylon Fibers division, James Cameron wants all three divisions focusing on the correct avenues for improving division performance. Calculate the margin, asset turnover and return on investment for Centex Yarns, three divisions. (Round margin to 0 decimal places e.g. 15% and all other answers to 1 decimal place, e.g. 15.2.) Margin Asset turnover Return on investment Polyester Fibres times Rope times Nylon Fibres times
Step by Step Solution
There are 3 Steps involved in it

Get step-by-step solutions from verified subject matter experts