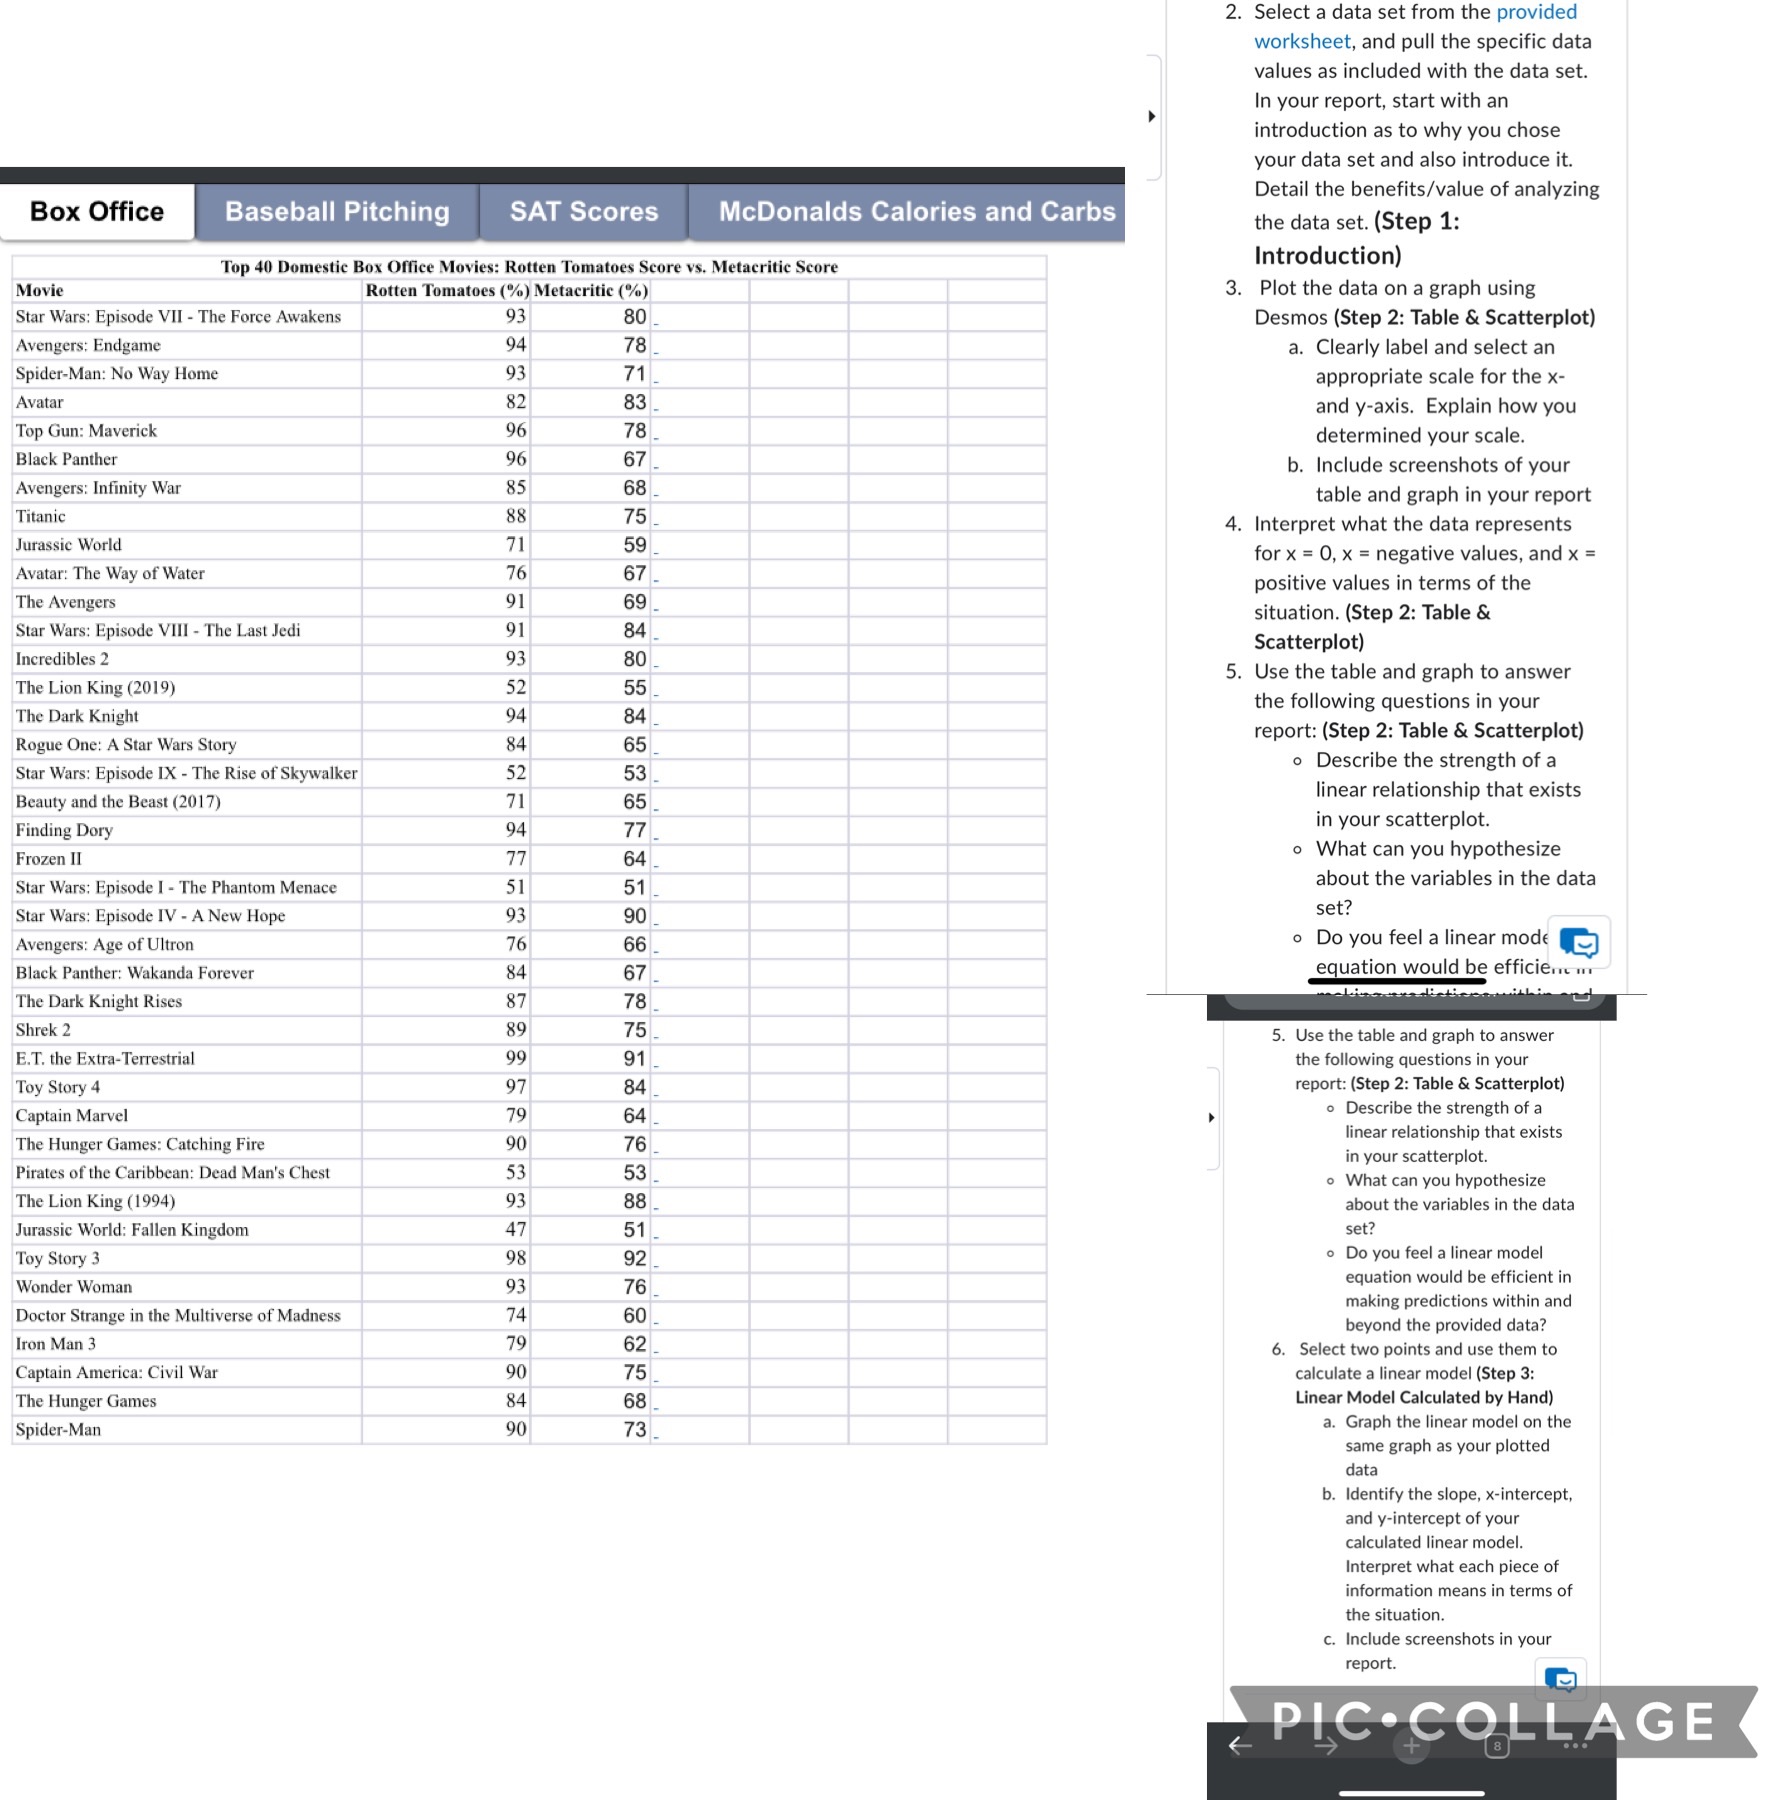
Question: Provided worksheet is on the left 2. Select a data set from the provided worksheet, and pull the specific data values as included with the

Provided worksheet is on the left

Provided worksheet is on the left 2. Select a
2. Select a data set from the provided worksheet, and pull the specific data values as included with the data set. In your report, start with an introduction as to why you chose your data set and also introduce it. Detail the benefits/value of analyzing Box Office Baseball Pitching SAT Scores McDonalds Calories and Carbs the data set. (Step 1: Top 40 Domestic Box Office Movies: Rotten Tomatoes Score vs. Metacritic Score Introduction) Movie Rotten Tomatoes (%) Metacritic (% 3. Plot the data on a graph using Star Wars: Episode VII - The Force Awakens 93 80 Desmos (Step 2: Table & Scatterplot) Avengers: Endgame 94 78 a. Clearly label and select an Spider-Man: No Way Home 93 71 appropriate scale for the x- Avatar 82 83 and y-axis. Explain how you Top Gun: Maverick 96 78 determined your scale. Black Panther 96 67 b. Include screenshots of your Avengers: Infinity War 85 68 table and graph in your report Titanic 88 75 4. Interpret what the data represents Jurassic World 71 59 for x = 0, x = negative values, and x = Avatar: The Way of Water 76 67 positive values in terms of the The Avengers 91 69 Star Wars: Episode VIII - The Last Jedi 91 84 situation. (Step 2: Table & Incredibles 2 93 80 Scatterplot) The Lion King (2019) 52 55 5. Use the table and graph to answer The Dark Knight 94 84 the following questions in your Rogue One: A Star Wars Story 84 65 report: (Step 2: Table & Scatterplot) Star Wars: Episode IX - The Rise of Skywalker 52 53 . Describe the strength of a Beauty and the Beast (2017) 71 65. linear relationship that exists Finding Dory 94 77 in your scatterplot. Frozen II 77 64 o What can you hypothesize Star Wars: Episode I - The Phantom Menace 51 51 about the variables in the data Star Wars: Episode IV - A New Hope 93 90 set? Avengers: Age of Ultron 76 66. o Do you feel a linear mode Black Panther: Wakanda Forever 84 67 equation would be efficient m The Dark Knight Rises 87 78 Shrek 2 89 75 E.T. the Extra-Terrestrial 99 5. Use the table and graph to answer 91. the following questions in your Toy Story 4 97 84 report: (Step 2: Table & Scatterplot) Captain Marvel 79 64. . Describe the strength of a The Hunger Games: Catching Fire 90 76 linear relationship that exists Pirates of the Caribbean: Dead Man's Chest 53 53 in your scatterplot. 93 . What can you hypothesize The Lion King (1994) 88 about the variables in the data Jurassic World: Fallen Kingdom 47 51 set ? Toy Story 3 98 92 . Do you feel a linear model Wonder Woman 93 76 equation would be efficient in Doctor Strange in the Multiverse of Madness 74 60 making predictions within and 79 62 beyond the provided data? Iron Man 3 6. Select two points and use them to Captain America: Civil War 90 75 calculate a linear model (Step 3: The Hunger Games 84 68. Linear Model Calculated by Hand) Spider-Man 90 73 a. Graph the linear model on the same graph as your plotted data b. Identify the slope, x-intercept, and y-intercept of your calculated linear model Interpret what each piece of information means in terms of the situation. C. Include screenshots in your report. G PIC. COLLAGE

Step by Step Solution

There are 3 Steps involved in it

1 Expert Approved Answer
Step: 1 Unlock blur-text-image
Question Has Been Solved by an Expert!

Get step-by-step solutions from verified subject matter experts

Step: 2 Unlock
Step: 3 Unlock

Students Have Also Explored These Related Mathematics Questions!