

Question: PSA12 comparative statement data for Spencer Ind and forests, a competiton Alldata relating to the statement of financial position are as at 30 June, the
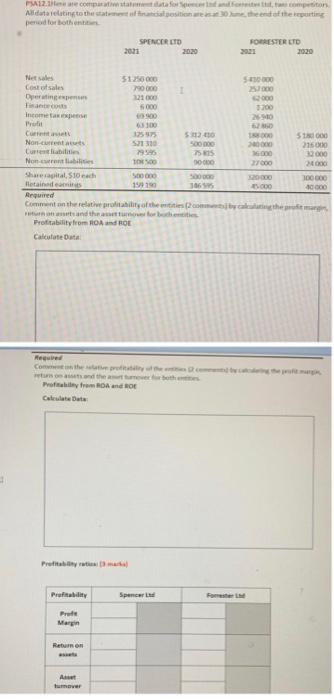
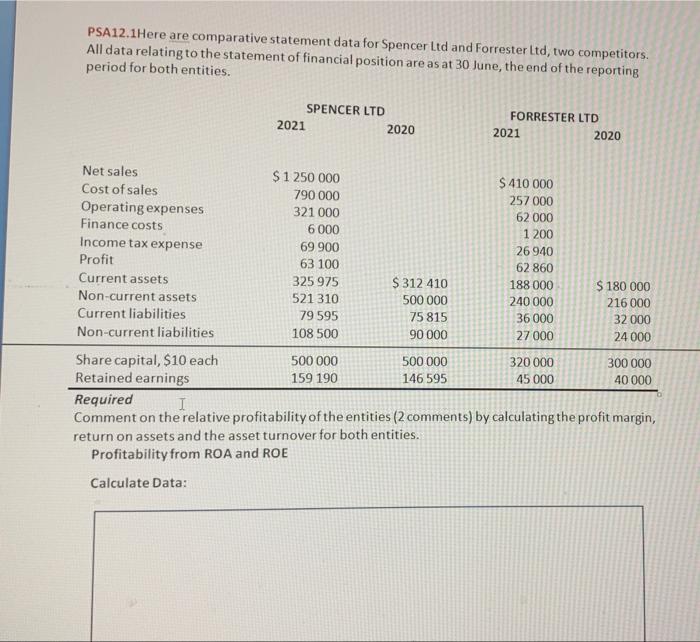
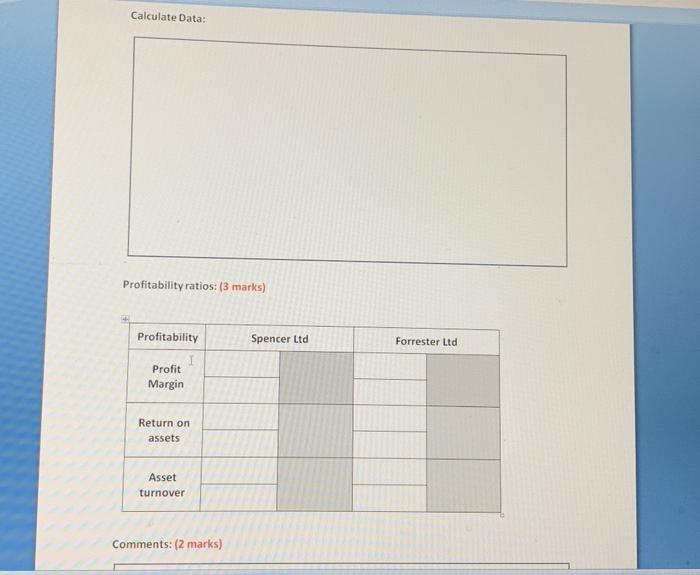
PSA12 comparative statement data for Spencer Ind and forests, a competiton Alldata relating to the statement of financial position are as at 30 June, the end of the reporting penod for both entities SPENCER LTD 2021 2020 FORRESTER LTD 2020 Net sales $1.250000 5430000 Cost of sales 790000 I 257000 Operating expenses 321000 Finance cos 5000 Income 60900 62000 $200 26940 Profit 63300 62960 Current assets 325-575 5312430 18000 518000 Non-current assets 521310 500000 240000 216000 Current liabilitie 79596 75815 36000 32000 Non-current liabilities 104500 90-000 27000 24000 Sharecapital, $10 each 500000 500000 320-000 100000 Retained earnings 159 190 346595 5000 40000 Required Comment on the relative profitability of the entities (2 comments by calculating the profit margin return on assets and the asset turnover for both entities Profitability from ROA and ROE Calculate Data Required Profitabiley from ROA and ROE Calculate Data Profitability [3 Profitability Spencer Ltd Forester L Profe Margin Return on A tumover PSA12.1Here are comparative statement data for Spencer Ltd and Forrester Ltd, two competitors. All data relating to the statement of financial position are as at 30 June, the end of the reporting period for both entities. SPENCER LTD FORRESTER LTD 2021 2020 2021 2020 Net sales Cost of sales Operating expenses $1250 000 790 000 321 000 Finance costs 6 000 $410 000 257 000 62 000 1 200 Income tax expense 69 900 26 940 Profit 63 100 62 860 Current assets 325 975 $ 312 410 188 000 Non-current assets 521 310 500 000 240 000 $180 000 216000 Current liabilities 79 595 75 815 36 000 32 000 Non-current liabilities 108 500 90 000 27 000 24 000 Share capital, $10 each 500 000 500 000 320 000 300 000 Retained earnings 159 190 146 595 45 000 40 000 Required I Comment on the relative profitability of the entities (2 comments) by calculating the profit margin, return on assets and the asset turnover for both entities. Profitability from ROA and ROE Calculate Data: Calculate Data: Profitability ratios: (3 marks) Profitability Spencer Ltd Forrester Ltd Profit Margin Return on assets Asset turnover Comments: (2 marks)
Step by Step Solution
There are 3 Steps involved in it

Get step-by-step solutions from verified subject matter experts