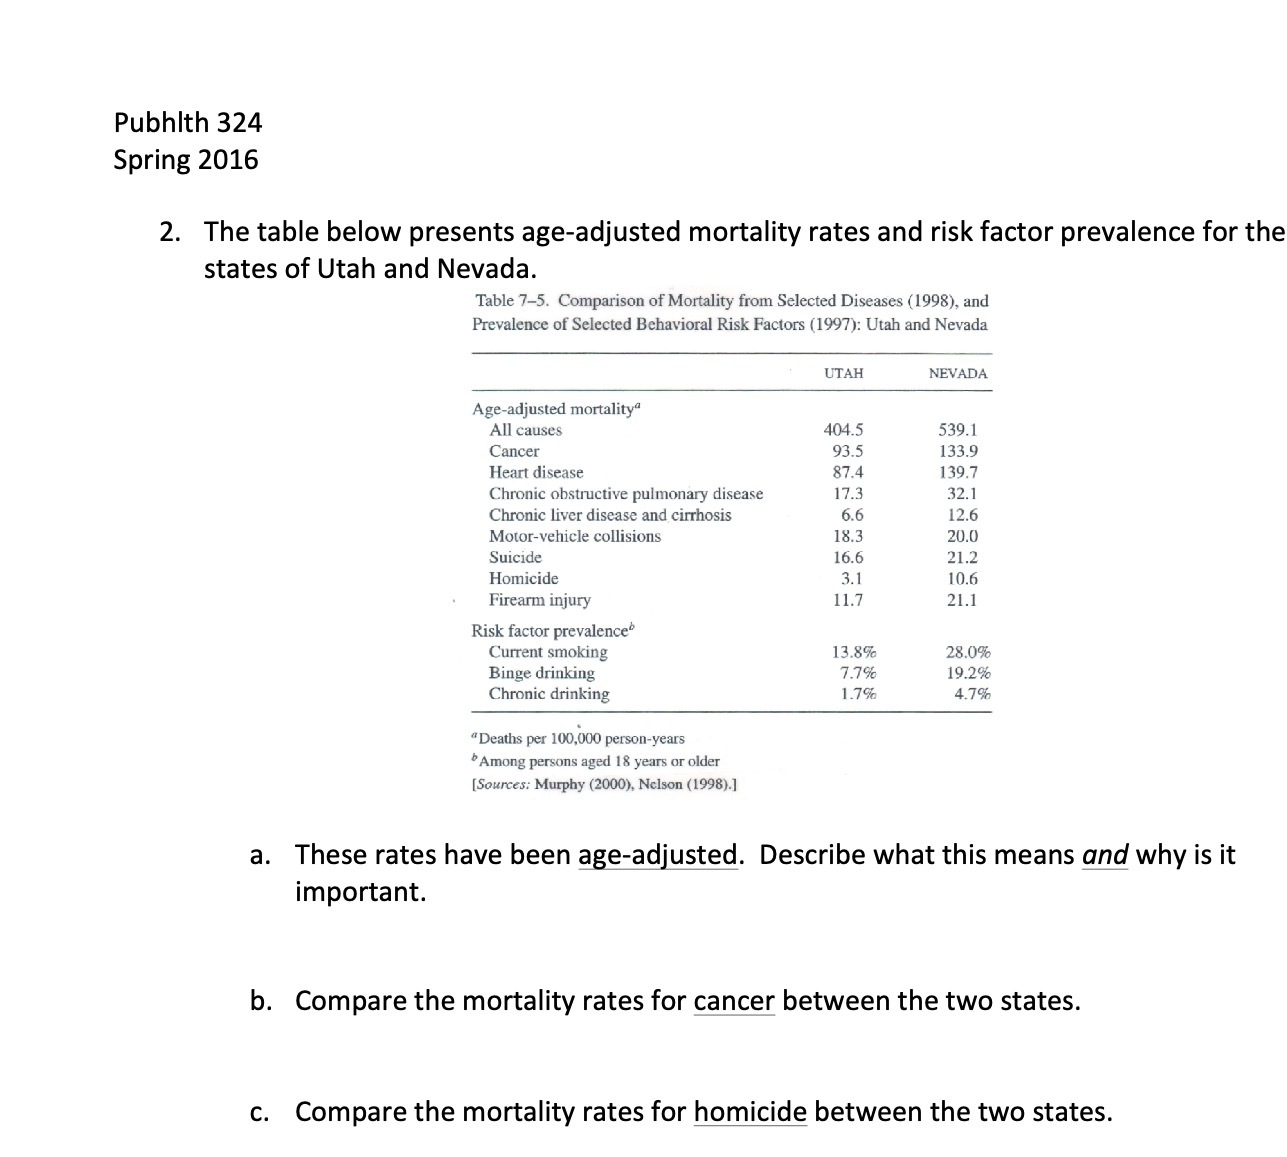
Question: Pubhith 324 Spring 2016 2 . The table below presents age- adjusted mortality rates and risk factor prevalence for the states of Utah and Nevada

Pubhith 324 Spring 2016 2 . The table below
Pubhith 324 Spring 2016 2 . The table below presents age- adjusted mortality rates and risk factor prevalence for the states of Utah and Nevada .* Table 7 - 5 . Comparison of Mortality from Selected Diseases ( 1998 ) , and Prevalence of Selected Behavioral Risk Factors ( 1997 1 : Utah and Nevada UTAH NEVADA Age - adjusted mortality* All causes 404.5 539. 1 Cancer* 93.5 133.9 Heart disease* 87.4 139. 7 Chronic obstructive pulmonary disease 17.3 32. 1 Chronic liver disease and cirrhosis* 6.6 12.6 Motor - vehicle collisions* 18.3 201.0 Suicide 16.6 21 . 2 Homicide* 3 .1 10.6 Firearm injury* 1 1 . 7 21. 1 Risk factor prevalence" Current smoking 13. 890 28.090 Binge drinking 7. 796 19. 2% Chronic drinking 1 . 7 9{ 4. 79 " Deaths per 1010. 0100 person - years " Among persons aged 18 years or older* [ Sources : Murphy ( 2000) , Nelson ( 1998 ) . 1 a . These rates have been age- adjusted . Describe what this means and why is it important . b. Compare the mortality rates for cancer between the two states . C. Compare the mortality rates for homicide between the two states

Step by Step Solution

There are 3 Steps involved in it

1 Expert Approved Answer
Step: 1 Unlock blur-text-image
Question Has Been Solved by an Expert!

Get step-by-step solutions from verified subject matter experts

Step: 2 Unlock
Step: 3 Unlock

Students Have Also Explored These Related General Management Questions!