

Punnett Square 2 shows a Punnett square describing a cross between two individuals from the F 1
Fantastic news! We've Found the answer you've been seeking!
Question:
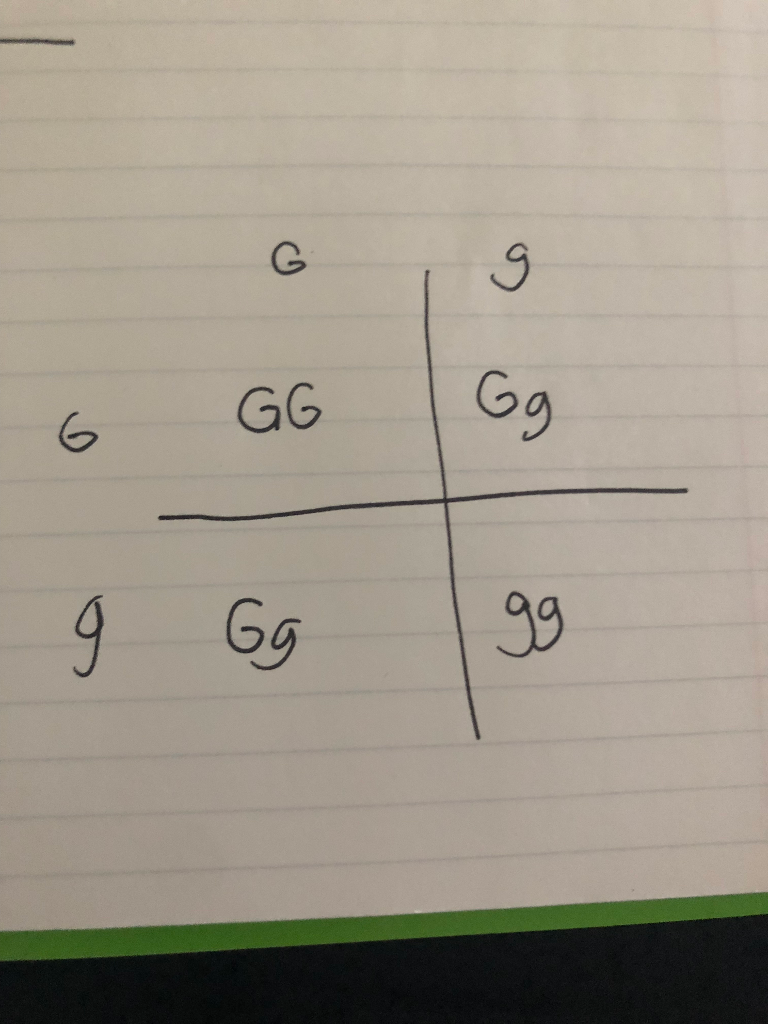
Punnett Square 2 shows a Punnett square describing a cross between two individuals from the F 1 generation. Was Punnett square 2 a good predictor of offspring phenotypes? Support your answer by calculating the percent of each phenotype that was expected and observed. Also, use the results of the chi-square test in Data Table 9 to support your answer.
Observed Values:
Green= 57
White= 12
Total= 69
Date table 9:
Degree Freedom= 1
P-value range= 0.500 to 0.050 (p>0.05)
Conclusion= There is no significant statistical difference between the observed and expected values.
Expert Answer:

Related Book For 

Elementary Statistics Picturing the World
ISBN: 978-0321911216
6th edition
Authors: Ron Larson, Betsy Farber
Posted Date:
