

Purpose: LAB 1 - INTENSITY VS DISTANCE (INVERSE SQUARE LAW) The purpose of this lab is...
Fantastic news! We've Found the answer you've been seeking!
Question:
Transcribed Image Text:
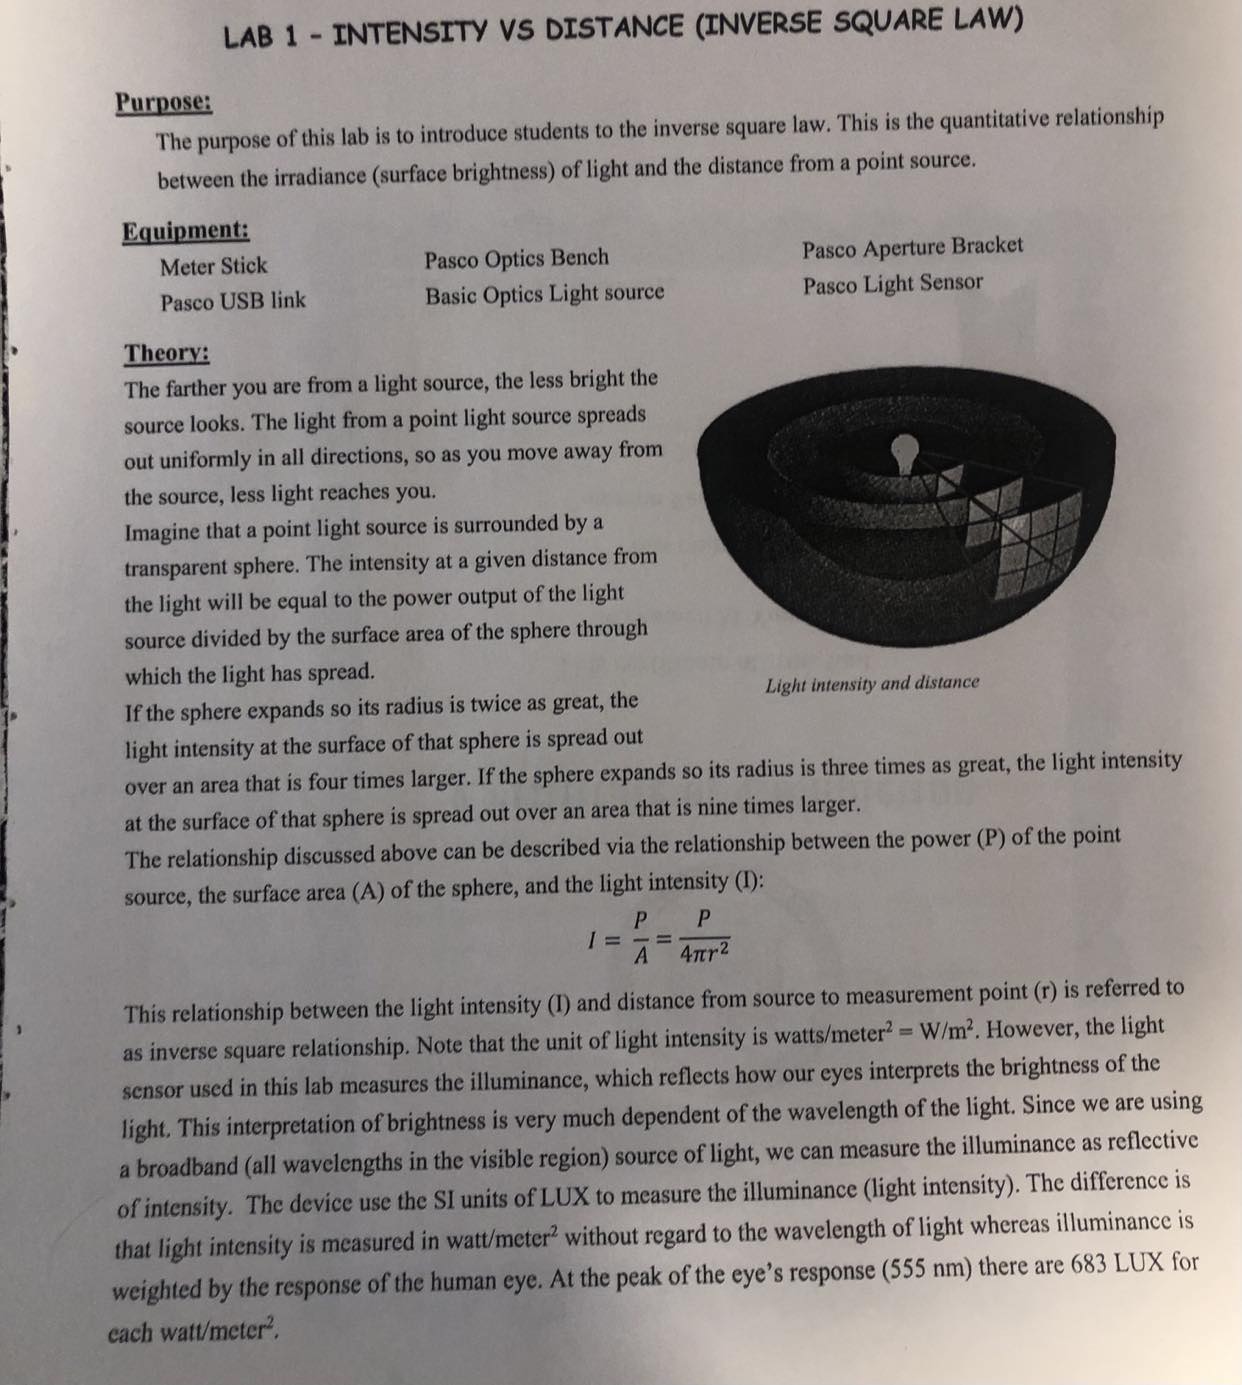
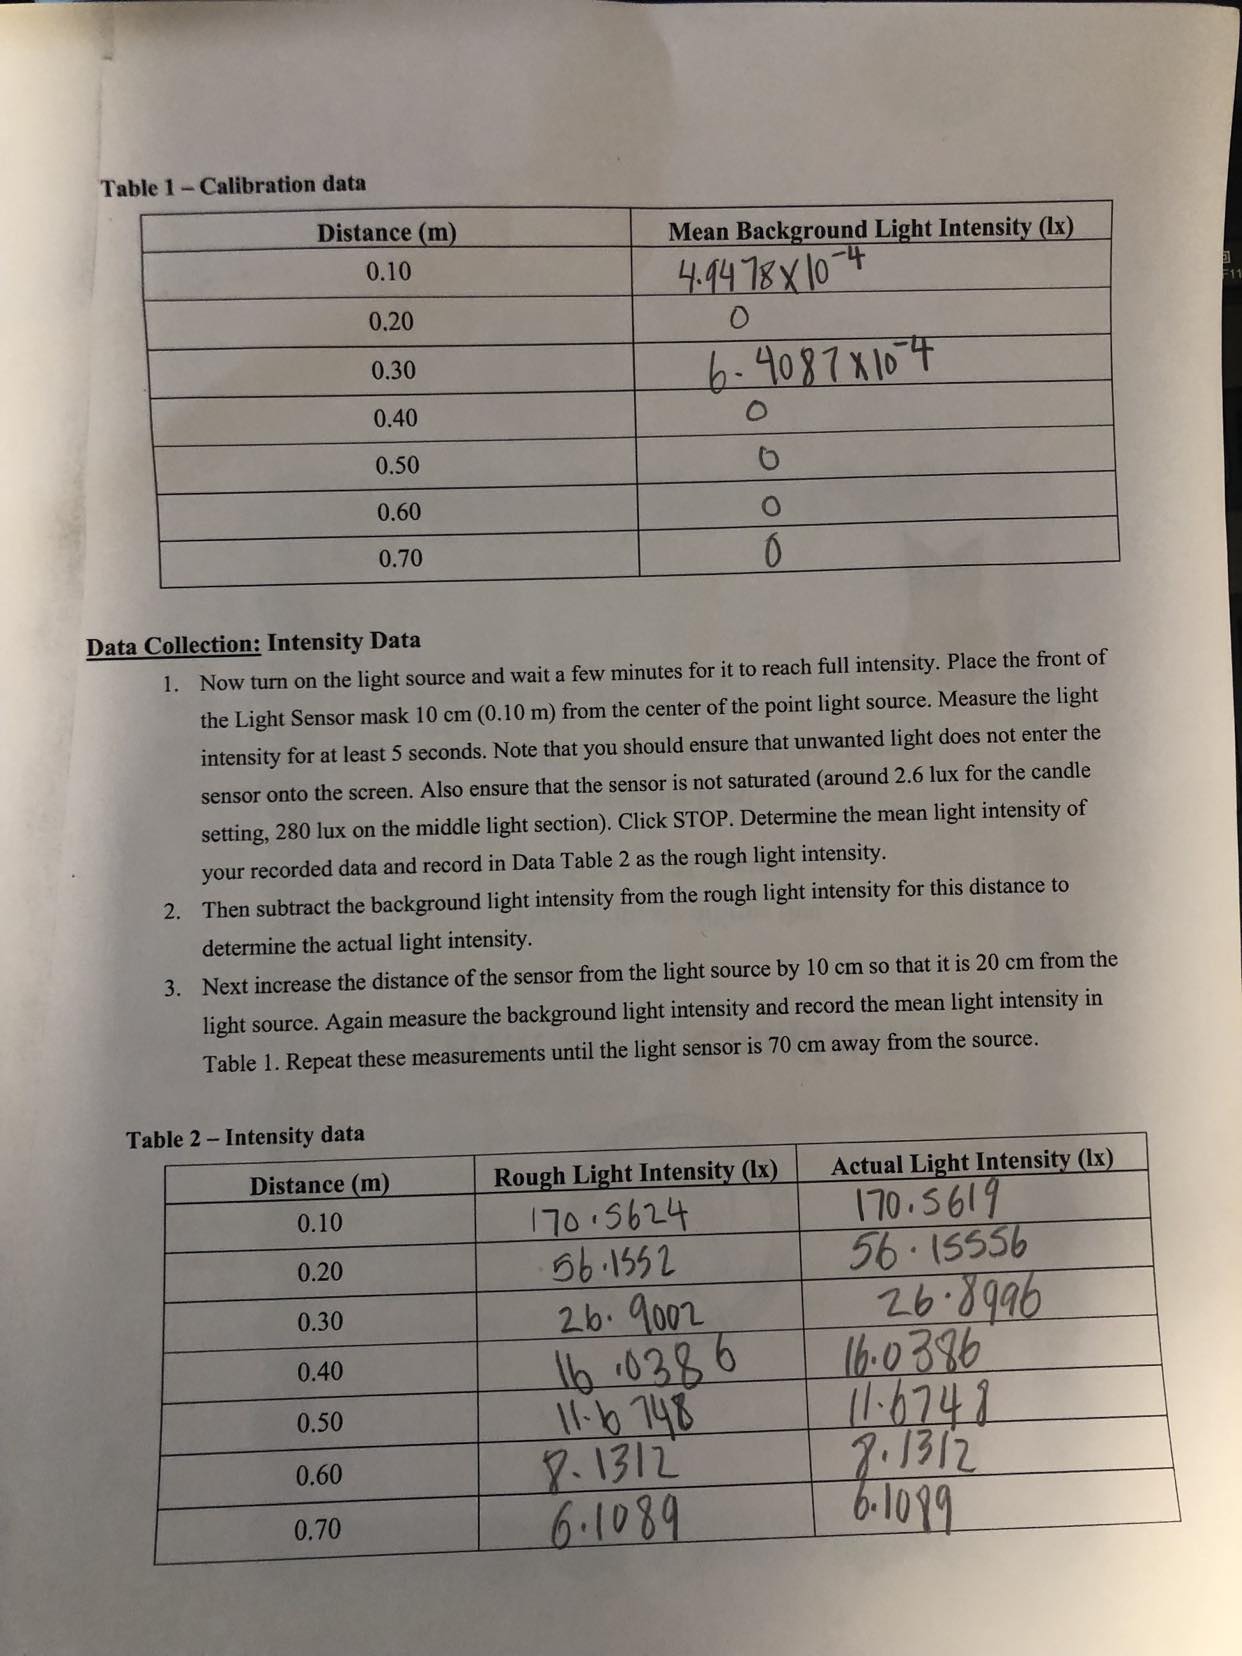
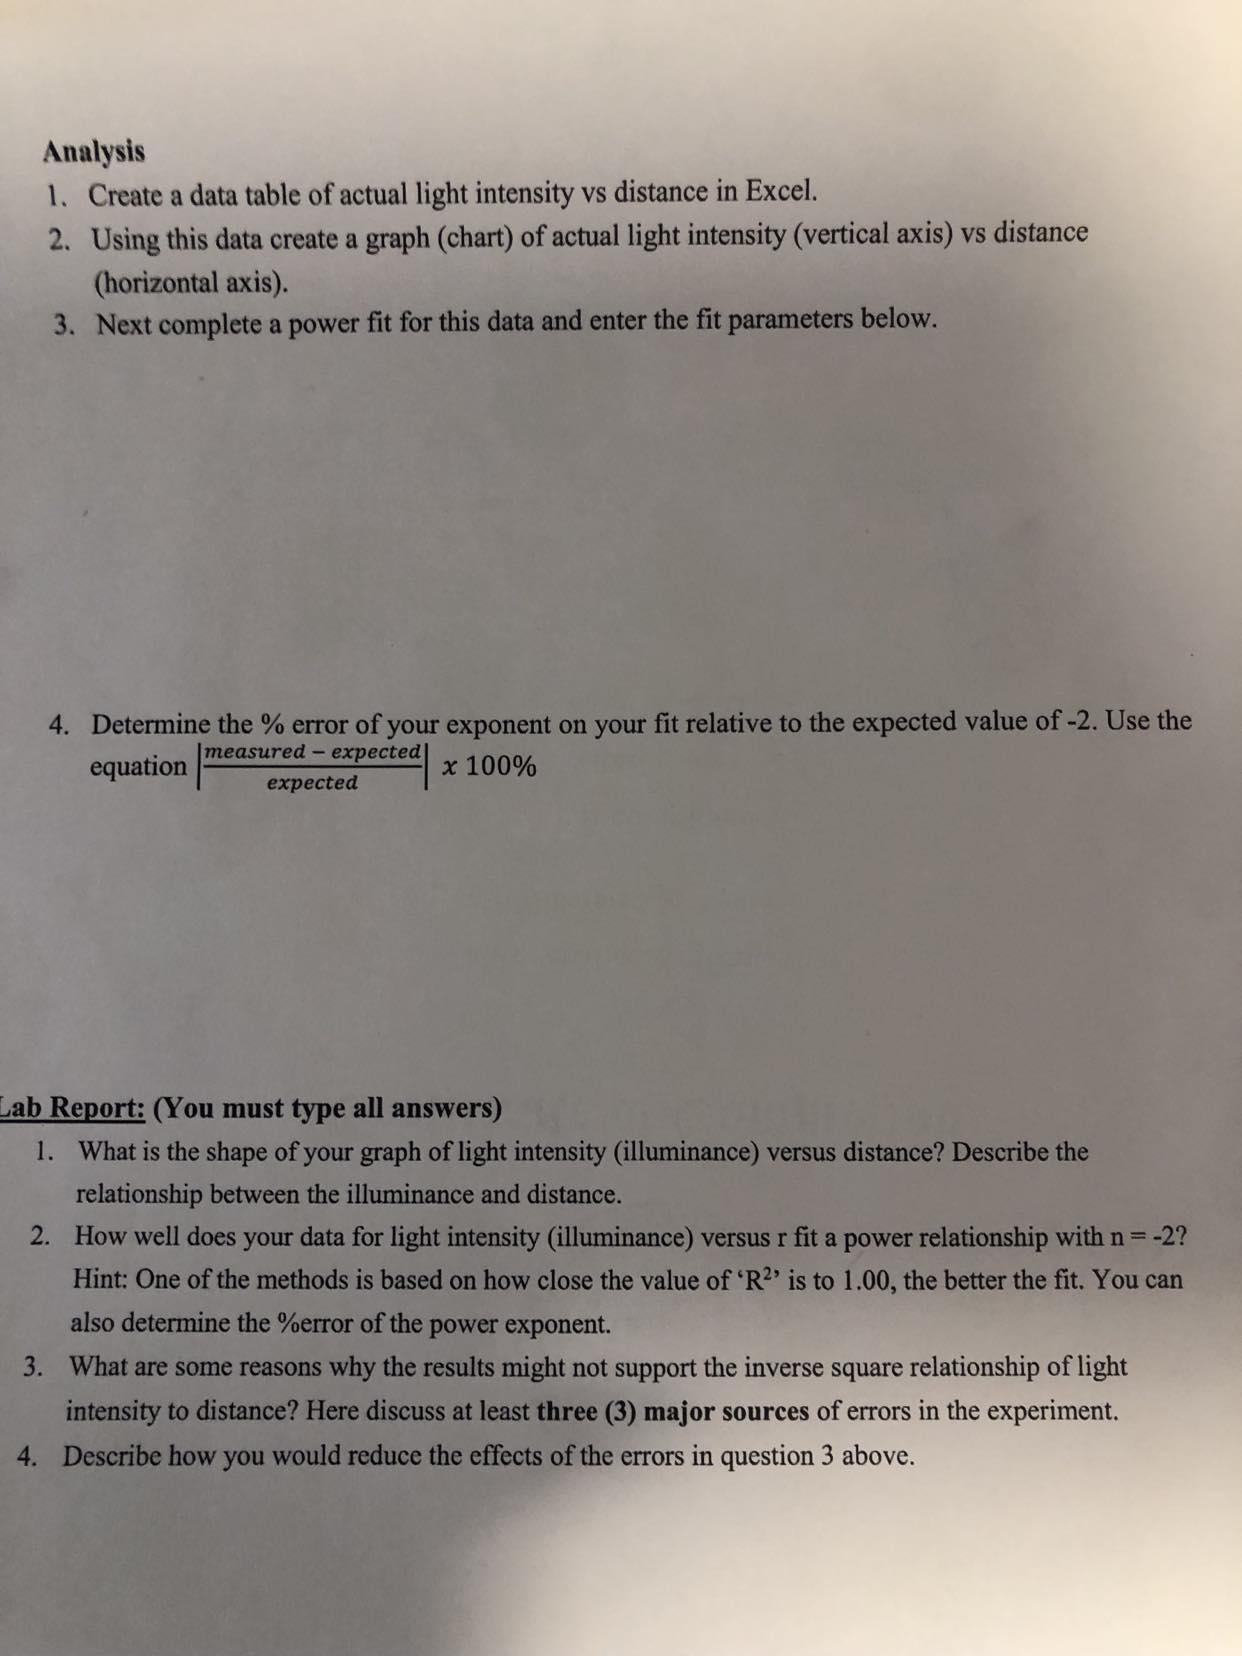
Purpose: LAB 1 - INTENSITY VS DISTANCE (INVERSE SQUARE LAW) The purpose of this lab is to introduce students to the inverse square law. This is the quantitative relationship between the irradiance (surface brightness) of light and the distance from a point source. Equipment: Meter Stick Pasco USB link Pasco Optics Bench Basic Optics Light source Pasco Aperture Bracket Pasco Light Sensor Theory: The farther you are from a light source, the less bright the source looks. The light from a point light source spreads out uniformly in all directions, so as you move away from the source, less light reaches you. Imagine that a point light source is surrounded by a transparent sphere. The intensity at a given distance from the light will be equal to the power output of the light source divided by the surface area of the sphere through which the light has spread. If the sphere expands so its radius is twice as great, the light intensity at the surface of that sphere is spread out Light intensity and distance over an area that is four times larger. If the sphere expands so its radius is three times as great, the light intensity at the surface of that sphere is spread out over an area that is nine times larger. The relationship discussed above can be described via the relationship between the power (P) of the point source, the surface area (A) of the sphere, and the light intensity (I): P 1 = = A P 4r2 This relationship between the light intensity (I) and distance from source to measurement point (r) is referred to as inverse square relationship. Note that the unit of light intensity is watts/meter = W/m. However, the light sensor used in this lab measures the illuminance, which reflects how our eyes interprets the brightness of the light. This interpretation of brightness is very much dependent of the wavelength of the light. Since we are using a broadband (all wavelengths in the visible region) source of light, we can measure the illuminance as reflective of intensity. The device use the SI units of LUX to measure the illuminance (light intensity). The difference is that light intensity is measured in watt/meter without regard to the wavelength of light whereas illuminance is weighted by the response of the human eye. At the peak of the eye's response (555 nm) there are 683 LUX for each watt/meter. Table 1-Calibration data Distance (m) 0.10 0.20 0.30 Mean Background Light Intensity (lx) 4.9478x10⁴ 0 6-4087x104 0.40 0 0.50 0 0.60 0 0.70 0 Data Collection: Intensity Data 1. Now turn on the light source and wait a few minutes for it to reach full intensity. Place the front of the Light Sensor mask 10 cm (0.10 m) from the center of the point light source. Measure the light intensity for at least 5 seconds. Note that you should ensure that unwanted light does not enter the sensor onto the screen. Also ensure that the sensor is not saturated (around 2.6 lux for the candle setting, 280 lux on the middle light section). Click STOP. Determine the mean light intensity of your recorded data and record in Data Table 2 as the rough light intensity. 2. Then subtract the background light intensity from the rough light intensity for this distance to determine the actual light intensity. 3. Next increase the distance of the sensor from the light source by 10 cm so that it is 20 cm from the light source. Again measure the background light intensity and record the mean light intensity in Table 1. Repeat these measurements until the light sensor is 70 cm away from the source. Table 2- Intensity data Distance (m) 0.10 Rough Light Intensity (Ix) 170.5624 0.20 56.1552 Actual Light Intensity (lx) 170.5619 56.15556 0.30 26.9002 26.8996 0.40 16.0386 16.0386 0.50 11-6748 11.6748 0.60 8.1312 8.1312 0.70 6.1089 6.1089 E F11 Analysis 1. Create a data table of actual light intensity vs distance in Excel. 2. Using this data create a graph (chart) of actual light intensity (vertical axis) vs distance (horizontal axis). 3. Next complete a power fit for this data and enter the fit parameters below. 4. Determine the % error of your exponent on your fit relative to the expected value of -2. Use the measured - expected equation x 100% expected Lab Report: (You must type all answers) 1. What is the shape of your graph of light intensity (illuminance) versus distance? Describe the relationship between the illuminance and distance. 2. How well does your data for light intensity (illuminance) versus r fit a power relationship with n = -2? Hint: One of the methods is based on how close the value of 'R2 is to 1.00, the better the fit. You can also determine the %error of the power exponent. 3. What are some reasons why the results might not support the inverse square relationship of light intensity to distance? Here discuss at least three (3) major sources of errors in the experiment. 4. Describe how you would reduce the effects of the errors in question 3 above. Purpose: LAB 1 - INTENSITY VS DISTANCE (INVERSE SQUARE LAW) The purpose of this lab is to introduce students to the inverse square law. This is the quantitative relationship between the irradiance (surface brightness) of light and the distance from a point source. Equipment: Meter Stick Pasco USB link Pasco Optics Bench Basic Optics Light source Pasco Aperture Bracket Pasco Light Sensor Theory: The farther you are from a light source, the less bright the source looks. The light from a point light source spreads out uniformly in all directions, so as you move away from the source, less light reaches you. Imagine that a point light source is surrounded by a transparent sphere. The intensity at a given distance from the light will be equal to the power output of the light source divided by the surface area of the sphere through which the light has spread. If the sphere expands so its radius is twice as great, the light intensity at the surface of that sphere is spread out Light intensity and distance over an area that is four times larger. If the sphere expands so its radius is three times as great, the light intensity at the surface of that sphere is spread out over an area that is nine times larger. The relationship discussed above can be described via the relationship between the power (P) of the point source, the surface area (A) of the sphere, and the light intensity (I): P 1 = = A P 4r2 This relationship between the light intensity (I) and distance from source to measurement point (r) is referred to as inverse square relationship. Note that the unit of light intensity is watts/meter = W/m. However, the light sensor used in this lab measures the illuminance, which reflects how our eyes interprets the brightness of the light. This interpretation of brightness is very much dependent of the wavelength of the light. Since we are using a broadband (all wavelengths in the visible region) source of light, we can measure the illuminance as reflective of intensity. The device use the SI units of LUX to measure the illuminance (light intensity). The difference is that light intensity is measured in watt/meter without regard to the wavelength of light whereas illuminance is weighted by the response of the human eye. At the peak of the eye's response (555 nm) there are 683 LUX for each watt/meter. Table 1-Calibration data Distance (m) 0.10 0.20 0.30 Mean Background Light Intensity (lx) 4.9478x10⁴ 0 6-4087x104 0.40 0 0.50 0 0.60 0 0.70 0 Data Collection: Intensity Data 1. Now turn on the light source and wait a few minutes for it to reach full intensity. Place the front of the Light Sensor mask 10 cm (0.10 m) from the center of the point light source. Measure the light intensity for at least 5 seconds. Note that you should ensure that unwanted light does not enter the sensor onto the screen. Also ensure that the sensor is not saturated (around 2.6 lux for the candle setting, 280 lux on the middle light section). Click STOP. Determine the mean light intensity of your recorded data and record in Data Table 2 as the rough light intensity. 2. Then subtract the background light intensity from the rough light intensity for this distance to determine the actual light intensity. 3. Next increase the distance of the sensor from the light source by 10 cm so that it is 20 cm from the light source. Again measure the background light intensity and record the mean light intensity in Table 1. Repeat these measurements until the light sensor is 70 cm away from the source. Table 2- Intensity data Distance (m) 0.10 Rough Light Intensity (Ix) 170.5624 0.20 56.1552 Actual Light Intensity (lx) 170.5619 56.15556 0.30 26.9002 26.8996 0.40 16.0386 16.0386 0.50 11-6748 11.6748 0.60 8.1312 8.1312 0.70 6.1089 6.1089 E F11 Analysis 1. Create a data table of actual light intensity vs distance in Excel. 2. Using this data create a graph (chart) of actual light intensity (vertical axis) vs distance (horizontal axis). 3. Next complete a power fit for this data and enter the fit parameters below. 4. Determine the % error of your exponent on your fit relative to the expected value of -2. Use the measured - expected equation x 100% expected Lab Report: (You must type all answers) 1. What is the shape of your graph of light intensity (illuminance) versus distance? Describe the relationship between the illuminance and distance. 2. How well does your data for light intensity (illuminance) versus r fit a power relationship with n = -2? Hint: One of the methods is based on how close the value of 'R2 is to 1.00, the better the fit. You can also determine the %error of the power exponent. 3. What are some reasons why the results might not support the inverse square relationship of light intensity to distance? Here discuss at least three (3) major sources of errors in the experiment. 4. Describe how you would reduce the effects of the errors in question 3 above.
Expert Answer:

Posted Date:
Students also viewed these physics questions
-
Which of the following variable types can be used in a switch statement under some circumstances? (Choose three.) A. An enumerated type B. StringBuilder C. Byte D. Double E. var F. Exception.
-
Radon, Inc.s February 28th bank statement showed an ending cash balance of $10,640. On February 28, Radons general ledger cash account showed a balance of $10,869. After comparing the general ledger...
-
The following are the summarized financial statements of Ingrid Ltd and Epona Ltd, two firms that operate in identical industries. Required a. Calculate three ratios for each company showing...
-
Use the August information from the Work Together above. An income statement for Cheries Pizza is included in the Working Papers. Work independently to complete this problem. 1. Calculate the...
-
Karlik Enterprises distributes a single product whose selling price is $24 and whose variable expense is $18 per unit. The companys monthly fixed expense is $24,000. Required: 1. Prepare a...
-
Xfx Accessibility Tab Summary: The first table contains company data. The last two tables ask students to calculate the dollar value and rate of return for option tra A B D E F G H I J K L M Wilson,...
-
Choose a brand and scan the internet (blogs, website reviews etc), explain in detail the top 5 topics being discussed, indicate if the brands are positive or negative and explain in detail some of...
-
1/ List and describe 2 key features of an Inventory Control System 2/ What is the LAST method? List and briefly describe each point in the LAST method. 3/ Service bartenders, bussers, hosts and food...
-
Out of 300 people sampled, 42 had kids. Based on this, construct a 90% confidence interval for the true population proportion of people with kids. Give your answers as decimals, to three places < p
-
1. What is planning, features of planning, aspects of planning in an any organizations? 2. What types of plans are there, and discussing plans is one of those kinds of plans
-
Abandonment option: Consider a 3-year project with a 14.00% cost of capital. The initial investment is $1,000 and the expected cash flows are $400 per year. a. Calculate NPV and determine whether or...
-
You state, "The Financial Service Sector is an important issue because of its vital role in ensuring that the nation's economy is functional. Regarding the security of the nation, today, many...
-
Describe Mishkin et al. (1983) experiment (tasks, surgery, results) and discuss how it is evidence for a Where and What pathway along with the behavior of individuals with agnosia?
-
Data 9.2 on page 540 introduces the dataset Cereal, which includes information on the number of grams of fiber in a serving for 30 different breakfast cereals. The cereals come from three different...
-
Let \(h: \boldsymbol{x} \mapsto \mathbb{R}\) be a convex function and let \(\boldsymbol{X}\) be a random variable. Use the subgradient definition of convexity to prove Jensen's inequality: \[...
-
The purpose of this exercise is to prove the following Vapnik-Chernovenkis bound: for any finite class \(\mathscr{G}\) (containing only a finite number \(|\mathscr{G}|\) of possible functions) and a...
-
Using Jensen's inequality, show that the Kullback-Leibler divergence between probability densities \(f\) and \(g\) is always positive; that is, \[ \mathbb{E} \ln...

Study smarter with the SolutionInn App