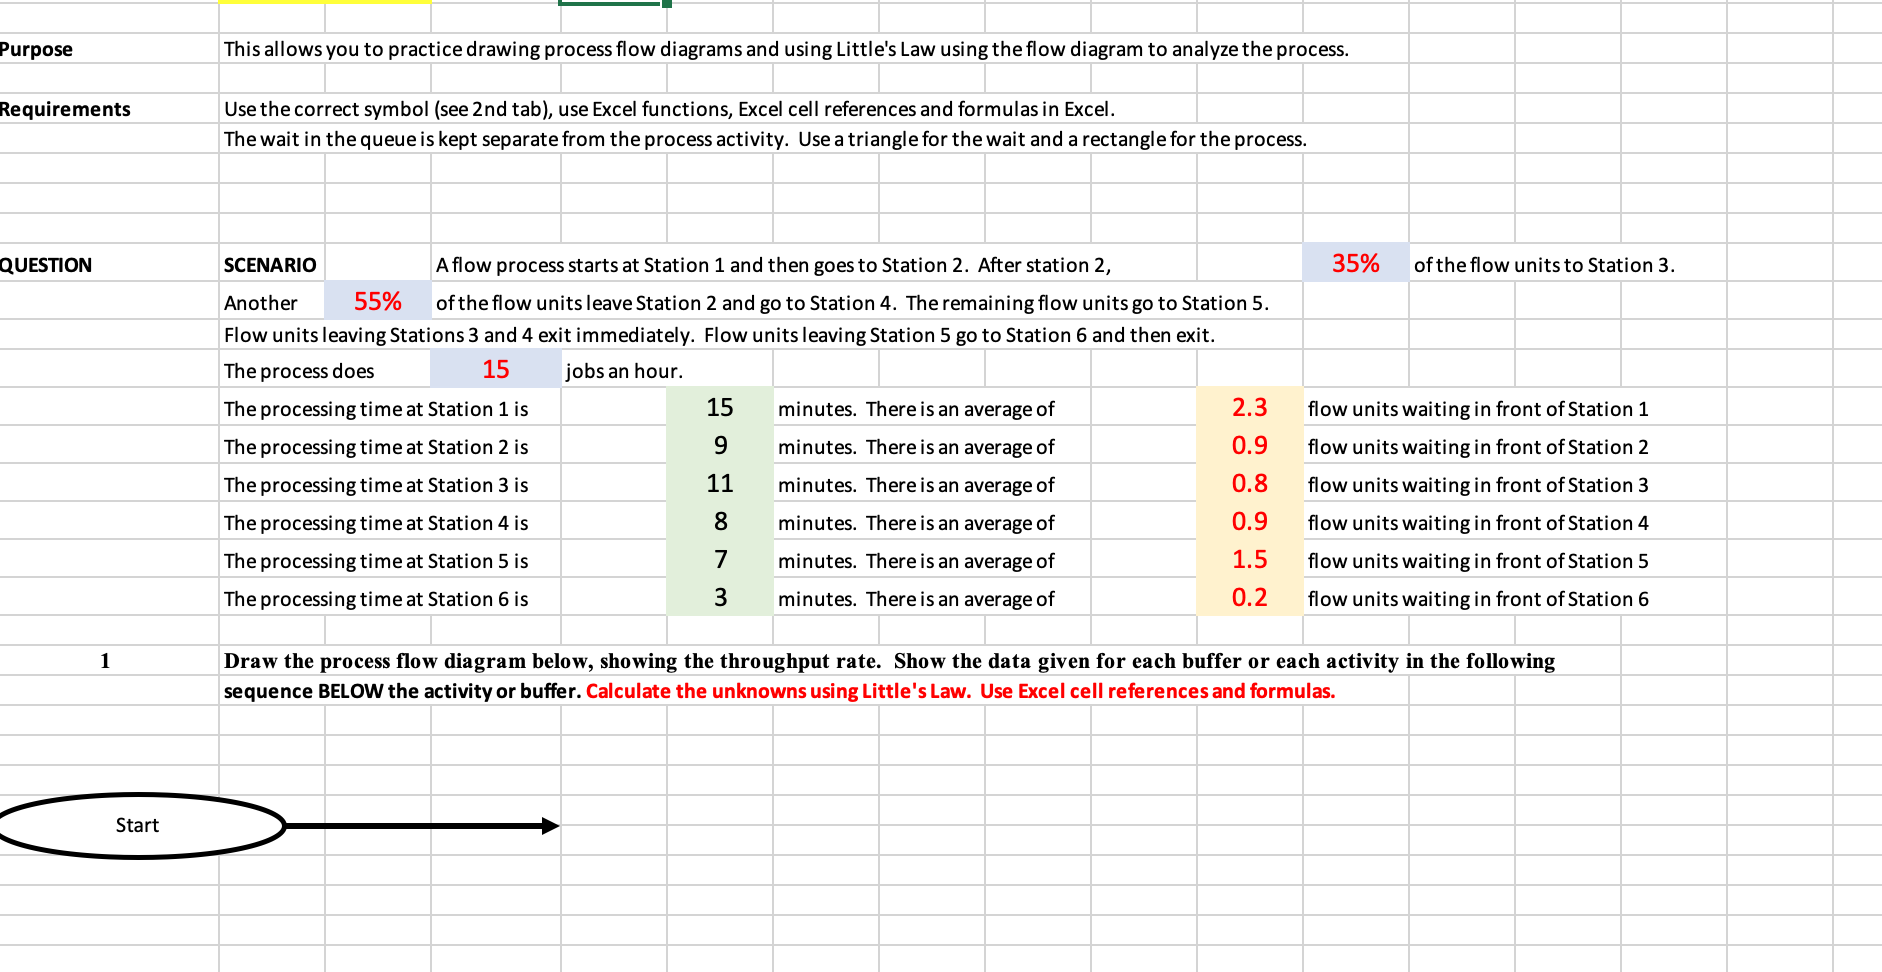
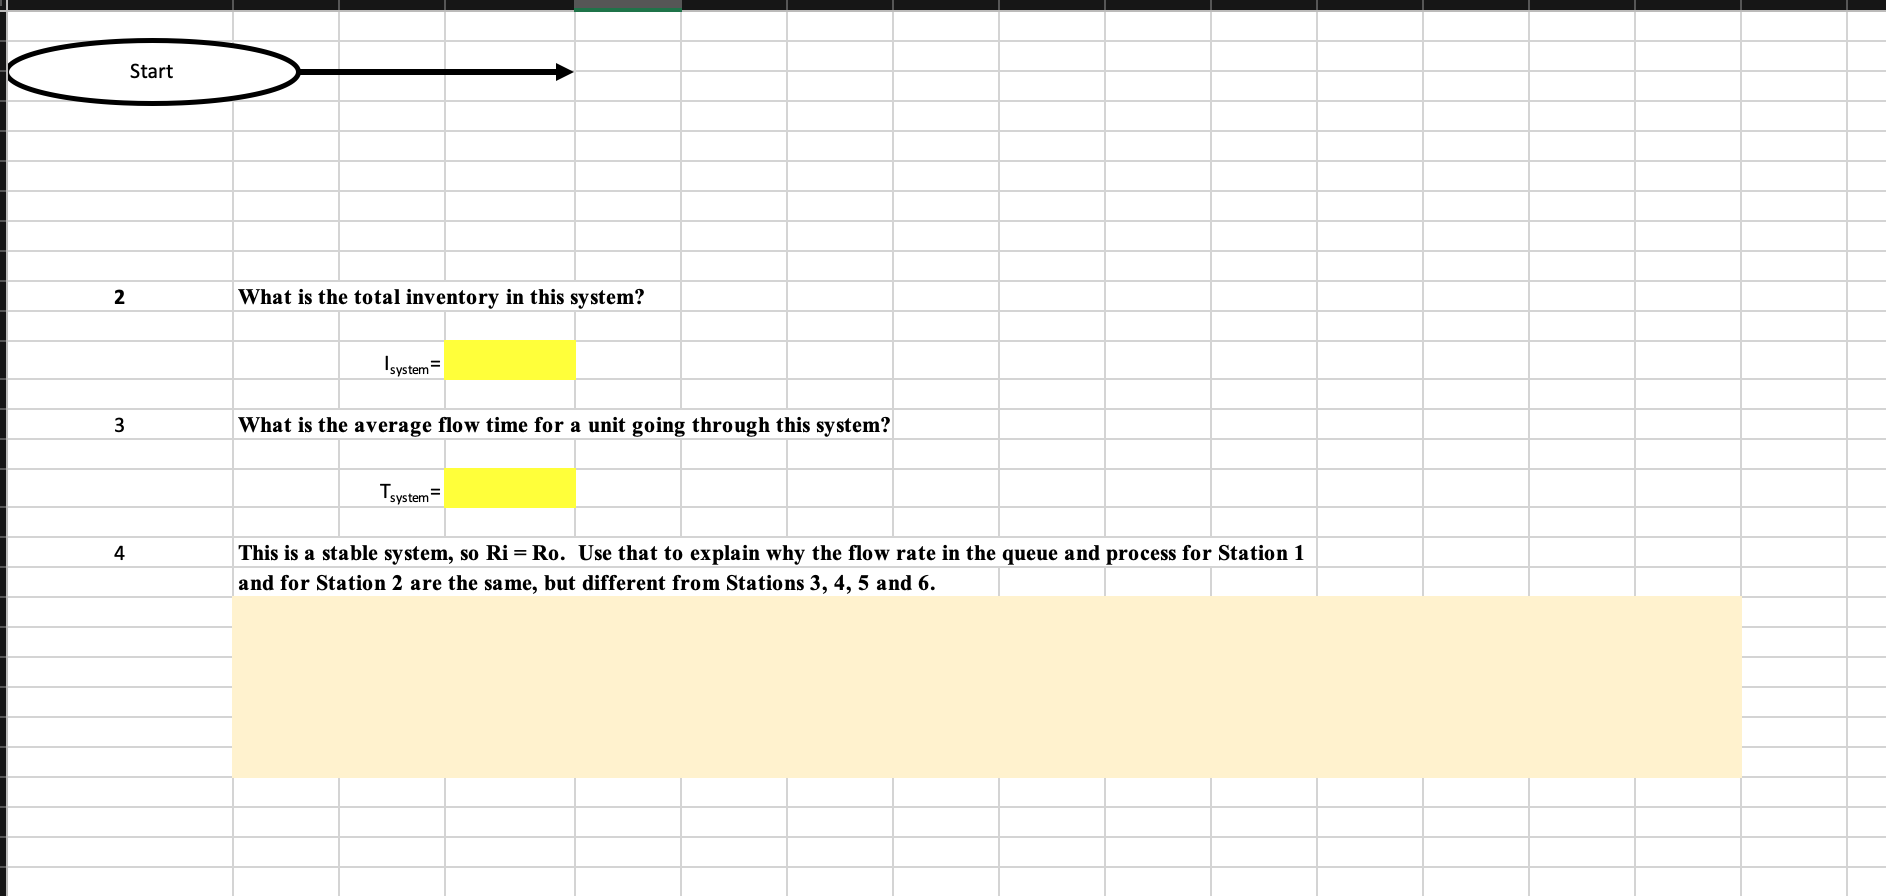
Question: Purpose This allows you to practice drawing process flow diagrams and using Little's Law using the flow diagram to analyze the process. Requirements Use the

Purpose This allows you to practice drawingPurpose This allows you to practice drawing

Purpose This allows you to practice drawing process flow diagrams and using Little's Law using the flow diagram to analyze the process. Requirements Use the correct symbol (see 2nd tab), use Excel functions, Excel cell references and formulas in Excel. The wait in the queue is kept separate from the process activity. Use a triangle for the wait and a rectangle for the process. QUESTION 35% of the flow units to Station 3. SCENARIO Aflow process starts at Station 1 and then goes to Station 2. After station 2, Another 55% of the flow units leave Station 2 and go to Station 4. The remaining flow units go to Station 5. Flow units leaving Stations 3 and 4 exit immediately. Flow units leaving Station 5 go to Station 6 and then exit. The process does 15 jobs an hour. The processing time at Station 1 is 15 minutes. There is an average of 2.3 The processing time at Station 2 is 9 minutes. There is an average of 0.9 The processing time at Station 3 is 11 minutes. There is an average of 0.8 The processing time at Station 4 is minutes. There is an average of 0.9 The processing time at Station 5 is 7 minutes. There is an average of 1.5 The processing time at Station 6 is 3 minutes. There is an average of 0.2 flow units waiting in front of Station 1 flow units waiting in front of Station 2 flow units waiting in front of Station 3 flow units waiting in front of Station 4 flow units waiting in front of Station 5 flow units waiting in front of Station 6 8 1 Draw the process flow diagram below, showing the throughput rate. Show the data given for each buffer or each activity in the following sequence BELOW the activity or buffer. Calculate the unknowns using Little's Law. Use Excel cell references and formulas. Start Start 2 What is the total inventory in this system? Isystem 3 What is the average flow time for a unit going through this system? Tsystem = 4 This is a stable system, so Ri = Ro. Use that to explain why the flow rate in the queue and process for Station 1 and for Station 2 are the same, but different from Stations 3, 4, 5 and 6. Purpose This allows you to practice drawing process flow diagrams and using Little's Law using the flow diagram to analyze the process. Requirements Use the correct symbol (see 2nd tab), use Excel functions, Excel cell references and formulas in Excel. The wait in the queue is kept separate from the process activity. Use a triangle for the wait and a rectangle for the process. QUESTION 35% of the flow units to Station 3. SCENARIO Aflow process starts at Station 1 and then goes to Station 2. After station 2, Another 55% of the flow units leave Station 2 and go to Station 4. The remaining flow units go to Station 5. Flow units leaving Stations 3 and 4 exit immediately. Flow units leaving Station 5 go to Station 6 and then exit. The process does 15 jobs an hour. The processing time at Station 1 is 15 minutes. There is an average of 2.3 The processing time at Station 2 is 9 minutes. There is an average of 0.9 The processing time at Station 3 is 11 minutes. There is an average of 0.8 The processing time at Station 4 is minutes. There is an average of 0.9 The processing time at Station 5 is 7 minutes. There is an average of 1.5 The processing time at Station 6 is 3 minutes. There is an average of 0.2 flow units waiting in front of Station 1 flow units waiting in front of Station 2 flow units waiting in front of Station 3 flow units waiting in front of Station 4 flow units waiting in front of Station 5 flow units waiting in front of Station 6 8 1 Draw the process flow diagram below, showing the throughput rate. Show the data given for each buffer or each activity in the following sequence BELOW the activity or buffer. Calculate the unknowns using Little's Law. Use Excel cell references and formulas. Start Start 2 What is the total inventory in this system? Isystem 3 What is the average flow time for a unit going through this system? Tsystem = 4 This is a stable system, so Ri = Ro. Use that to explain why the flow rate in the queue and process for Station 1 and for Station 2 are the same, but different from Stations 3, 4, 5 and 6

Step by Step Solution

There are 3 Steps involved in it

1 Expert Approved Answer
Step: 1 Unlock blur-text-image
Question Has Been Solved by an Expert!

Get step-by-step solutions from verified subject matter experts

Step: 2 Unlock
Step: 3 Unlock

Students Have Also Explored These Related General Management Questions!