

Question: Purpose This assignment allows you to compare Pull vs . Pull strategies for different categories of products based on data analysis. You'll be able to
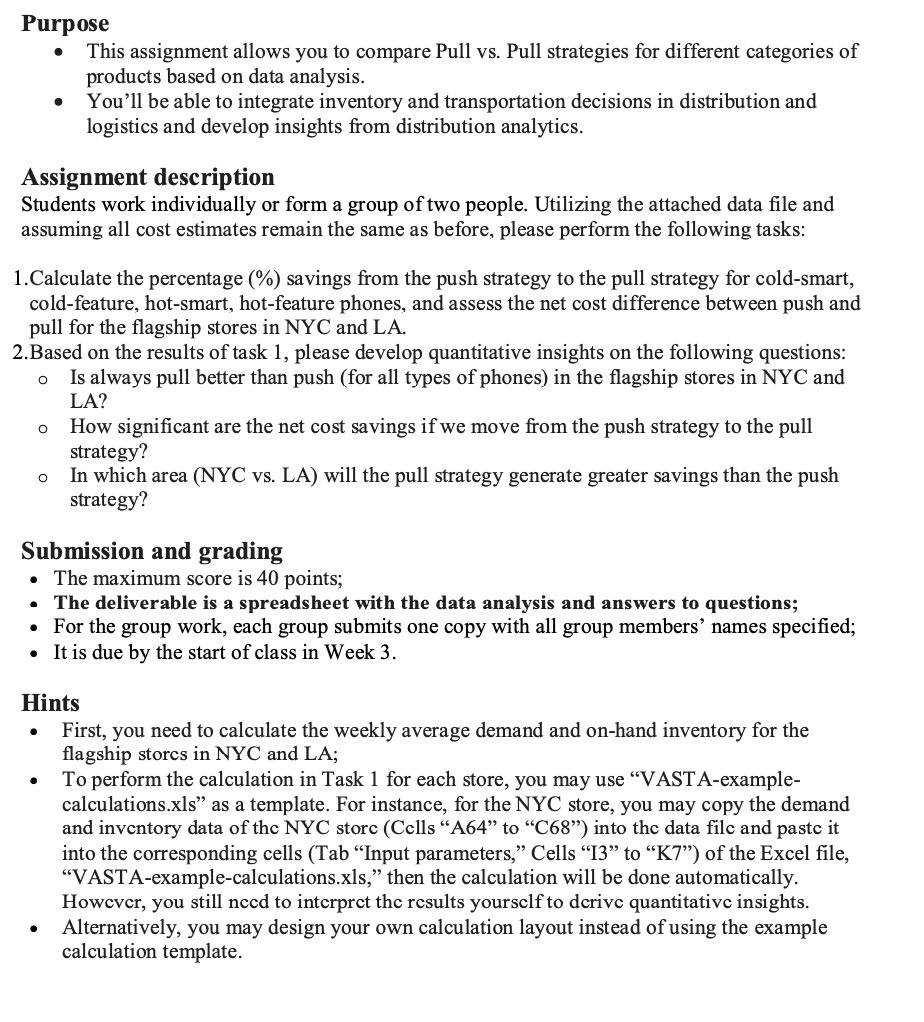
Purpose
This assignment allows you to compare Pull vs Pull strategies for different categories of
products based on data analysis.
You'll be able to integrate inventory and transportation decisions in distribution and
logistics and develop insights from distribution analytics.
Assignment description
Students work individually or form a group of two people. Utilizing the attached data file and
assuming all cost estimates remain the same as before, please perform the following tasks:
Calculate the percentage savings from the push strategy to the pull strategy for coldsmart,
coldfeature, hotsmart, hotfeature phones, and assess the net cost difference between push and
pull for the flagship stores in NYC and LA
Based on the results of task please develop quantitative insights on the following questions:
Is always pull better than push for all types of phones in the flagship stores in NYC and
LA
How significant are the net cost savings if we move from the push strategy to the pull
strategy?
In which area NYC vs LA will the pull strategy generate greater savings than the push
strategy?
Submission and grading
The maximum score is points;
The deliverable is a spreadsheet with the data analysis and answers to questions;
For the group work, each group submits one copy with all group members' names specified;
It is due by the start of class in Week
Hints
First, you need to calculate the weekly average demand and onhand inventory for the
flagship storcs in NYC and LA;
To perform the calculation in Task for each store, you may use "VASTAexample
calculations.xls as a template. For instance, for the NYC store, you may copy the demand
and inventory data of the NYC storc Cclls A to C into the data filc and pastc it
into the corresponding cells Tab "Input parameters," Cells I to K of the Excel file,
"VASTAexamplecalculations.xls then the calculation will be done automatically.
However, you still necd to interpret the results yoursclf to derive quantitative insights.
Alternatively, you may design your own calculation layout instead of using the example
calculation template.
Step by Step Solution
There are 3 Steps involved in it
1 Expert Approved Answer
Step: 1 Unlock

Question Has Been Solved by an Expert!
Get step-by-step solutions from verified subject matter experts
Step: 2 Unlock
Step: 3 Unlock