

Question: Purpose: To demonstrate the ability to build a worksheet, format a worksheet, embed a Pie chart, print a worksheet, and save a workbook. Problem:
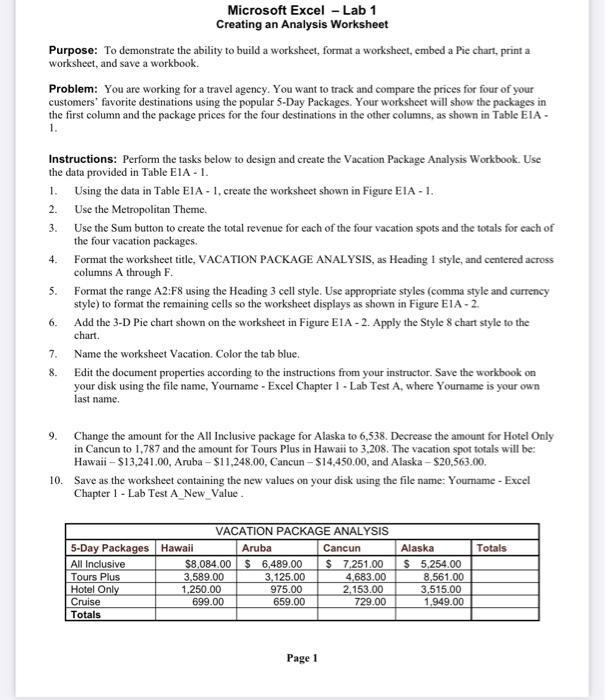
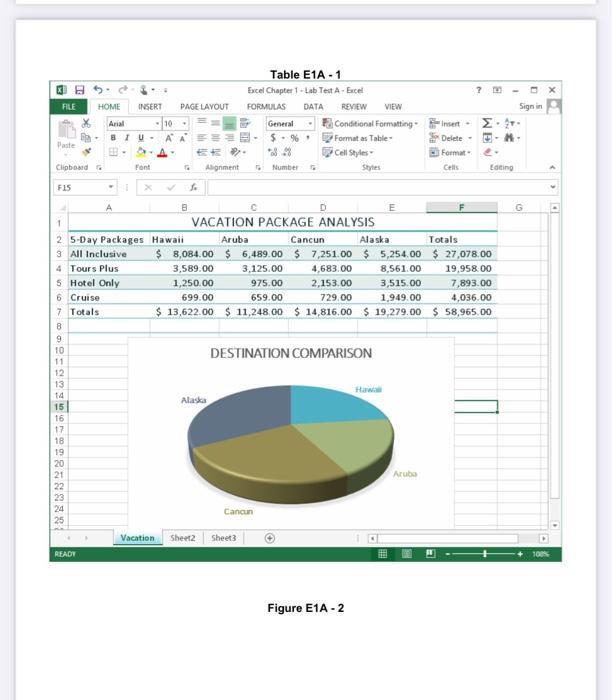
Purpose: To demonstrate the ability to build a worksheet, format a worksheet, embed a Pie chart, print a worksheet, and save a workbook. Problem: You are working for a travel agency. You want to track and compare the prices for four of your customers' favorite destinations using the popular 5-Day Packages. Your worksheet will show the packages in the first column and the package prices for the four destinations in the other columns, as shown in Table EIA- 1. Instructions: Perform the tasks below to design and create the Vacation Package Analysis Workbook. Use the data provided in Table EIA - 1. 1. 2. 3. 4. 5. Microsoft Excel - Lab 1 Creating an Analysis Worksheet 6. 7. 8. Using the data in Table E1A-1, create the worksheet shown in Figure EIA - 1. Use the Metropolitan Theme. Use the Sum button to create the total revenue for each of the four vacation spots and the totals for each of the four vacation packages. Format the worksheet title, VACATION PACKAGE ANALYSIS, as Heading I style, and centered across columns A through F. Format the range A2:F8 using the Heading 3 cell style. Use appropriate styles (comma style and currency style) to format the remaining cells so the worksheet displays as shown in Figure EIA-2. Add the 3-D Pie chart shown on the worksheet in Figure E1A-2. Apply the Style 8 chart style to the chart. Name the worksheet Vacation. Color the tab blue. Edit the document properties according to the instructions from your instructor. Save the workbook on your disk using the file name, Yourname - Excel Chapter 1 - Lab Test A, where Yourname is your own last name. 9. Change the amount for the All Inclusive package for Alaska to 6,538. Decrease the amount for Hotel Only in Cancun to 1,787 and the amount for Tours Plus in Hawaii to 3,208. The vacation spot totals will be: Hawaii - $13,241.00, Aruba-$11,248,00, Cancun-$14,450.00, and Alaska-$20,563.00. 10. Save as the worksheet containing the new values on your disk using the file name: Yourname - Excel Chapter 1 - Lab Test A_New_Value. VACATION PACKAGE ANALYSIS Aruba $8.084.00 $ 6,489.00 3,589.00 3,125.00 1,250.00 975.00 699.00 659.00 5-Day Packages Hawaii All Inclusive Tours Plus Hotel Only Cruise Totals Page 1 Cancun $ 7,251.00 4,683.00 2,153.00 729.00 Alaska $ 5,254.00 8,561.00 3,515.00 1,949.00 Totals FILE Paste F15 Clipboard G NENN28563633=3* 13 1 2 3 All Inclusive 4 Tours Plus 15 5 Hotel Only 6 Cruise 7 Totals 8 17 S 19 HOME 21 READY Arial 10 BIU- A A 4456 INSERT PAGE LAYOUT Font 1 x 8 5-Day Packages Hawaii ER G Alignment G Se Alaska Table E1A-1 Excel Chapter 1-Lab Test A- Excel DATA REVIEW VIEW Conditional Formatting Format as Table Cell Styles Vacation Sheet2 FORMULAS Sheet3 General $ %. 28 Number Cancun D DESTINATION COMPARISON Styles VACATION PACKAGE ANALYSIS Aruba Cancun Alaska $ 8,084.00 $ 6,489.00 $ 7,251.00 $ 5,254.00 $27,078.00 3,589.00 3,125.00 4,683.00 8,561.00 19,958.00 1,250.00 975.00 2,153.00 3,515.00 7,893.00 699.00 659.00 729.00 1,949.00 4,036.00 $ 13,622.00 $ 11,248.00 $14,816.00 $19,279.00 $ 58,965.00 Figure E1A-2 E Hawa Aruba Cells ? M Insert Delete - Formate Totals ... -M- Eating Sign in DX G 100% D
Step by Step Solution
3.36 Rating (152 Votes )
There are 3 Steps involved in it
Open your excel now On the Page Layout tab in the Themes gro... View full answer

Get step-by-step solutions from verified subject matter experts