

Question: PYTHON and SQL Requirement 6 or Question 6- read midway through . ALSO PLEASE take a screenshot of your answer and upload it., along with
PYTHON and SQL Requirement 6 or Question 6- read midway through. ALSO PLEASE take a screenshot of your answer and upload it., along with typing the code.
Background: I have an assignment where I pulled in data, and cleaned the data obtained from lacity.org that recorded details on LA traffic accidents. I prepped it and loaded it into a SQL database. I still need to continue to analyze the data, there is more cleaning that needs to happen. That's where I need your help!
https://data.lacity.org/Public-Safety/Traffic-Collision-Data-from-2010-to-Present/d5tf-ez2w
You don't have to go into the above link; it's more of an FYI.
Here are some of the Objectives the Professor gave us:
- Load data from a CSV file into a DataFrame Object
- Analyze the data using SQL and Python
- Use SQLalchemy to load data stored in a DataFrame object into SQLite database engine
- Use sqlalchemy to connect to SQLite database engine to execute SQL queries
- Execute different SQL queries
Load traffic data into a table in a SQLite database
- we are creating a database called LAtraffic
- we are creating a table called traffic
All the above is background information, including the objective, which is not your task. The Task is the Requirement or Question 6:
Because you don't have access to all the cleaning/ pre-processing that i did, you can give me the answer in a simple version from the samples below. It needs to be in clean code, with no unnecessary long code. The answer is a mix of SQL and PYTHON. However, a Full Version of the code is within some sample code i put in the reference below:
But first, here is the Requirement / Question:
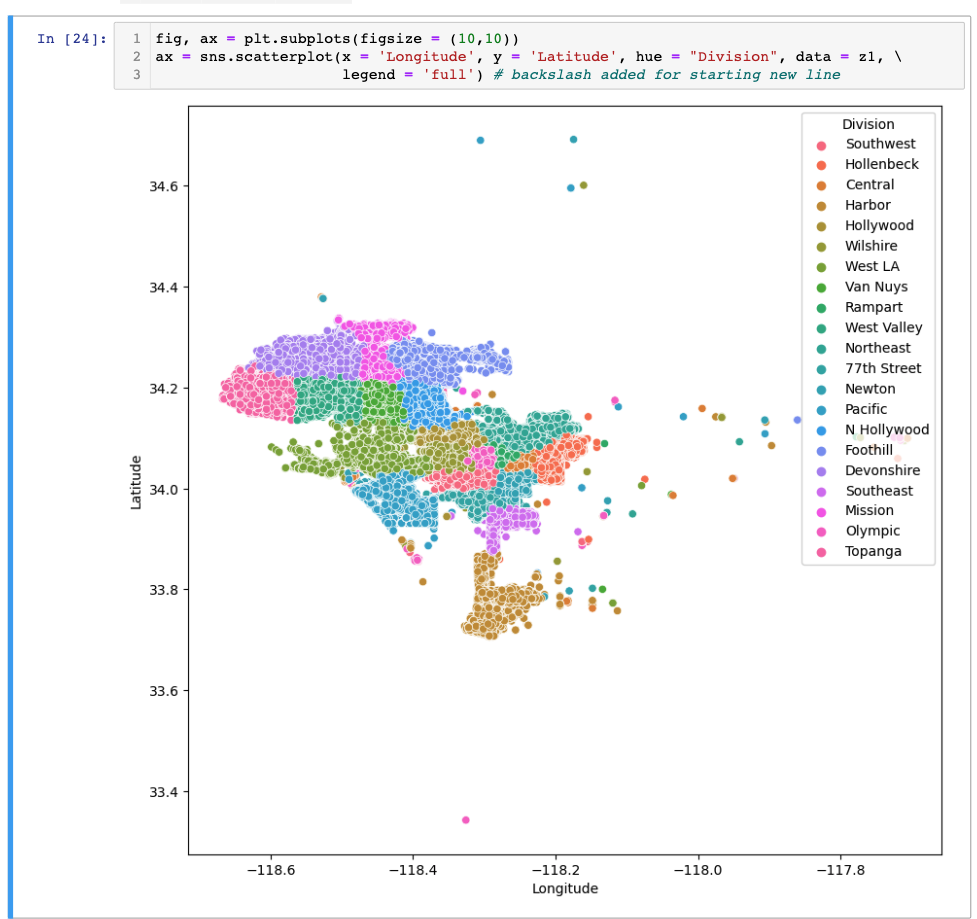
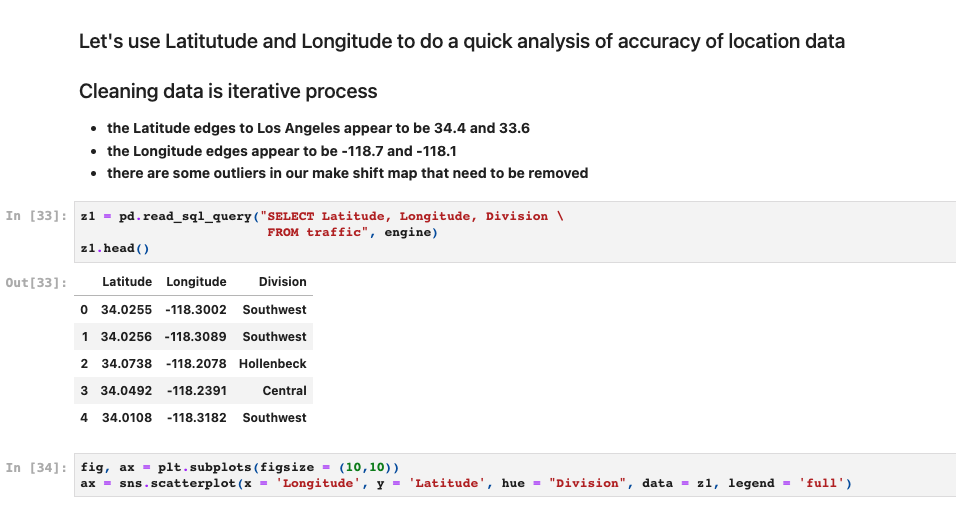
Requirement (Question 6): (5 points) Use SQL only to select valid latitudes and longitudes. Once you have the data, use matplotlib to plot latitude, and longitude and use the Division for hue. # I will take care of the official plot, since I have the original CSV files. all I need is the correct code. * The Latitude edges to Los Angeles appear to be 34.4 and 33.6 * The Longitude edges appear to be -118.7 and -118.1
You're going to run the same code, but we're going to do a query to get the latitude and longitude within range, so when we plot them, we won't get these outliers anymore.
Here's a snapshot (shape) of how the dateframe (db) looks
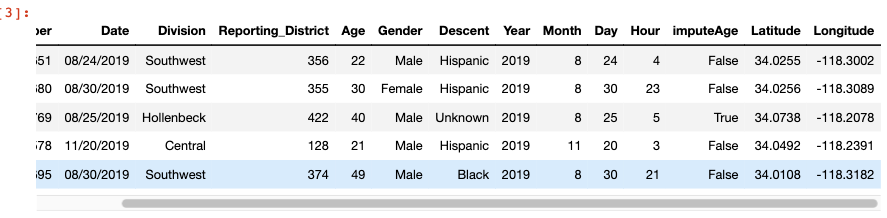
Basically
Use SQL to only select valid latitudes and longitudes, then use the data to use matplotlib to plot latitude and longitude and use the Division for hue. This was some of my Sample Code that was executed and run. You can see How i queried (SQL) through pandas.
The very last line of code just gave us the plot with the 'outliers' (latitude/longitude) that we have to eliminate.
------ Other References---- Code samples and Proper Clean code
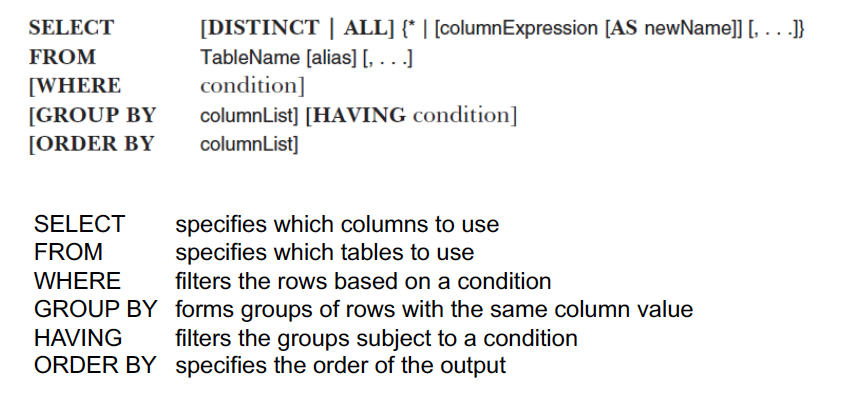
A sample Query where Traffic is the table name
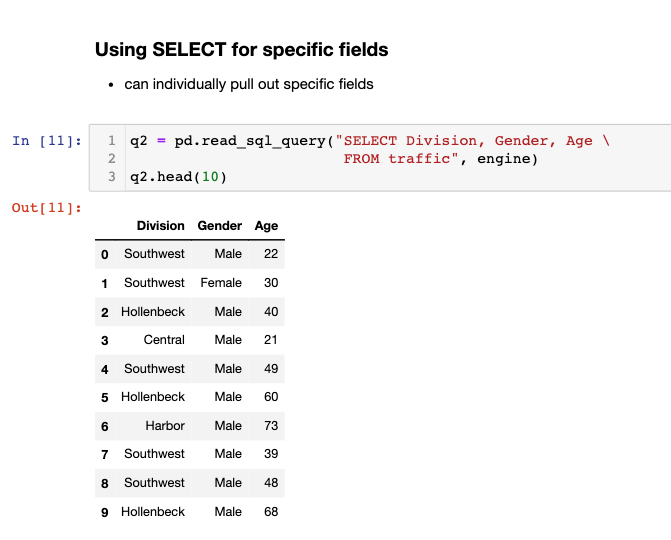
3] : \begin{tabular}{rrrrrrrrrrrrrr} ser & Date & Division & Reporting_District & Age & Gender & Descent & Year & Month & Day & Hour & imputeAge & Latitude & Longitude \\ \hline 51 & 08/24/2019 & Southwest & 356 & 22 & Male & Hispanic & 2019 & 8 & 24 & 4 & False & 34.0255 & 118.3002 \\ i80 & 08/30/2019 & Southwest & 355 & 30 & Female & Hispanic & 2019 & 8 & 30 & 23 & False & 34.0256 & 118.3089 \\ 69 & 08/25/2019 & Hollenbeck & 422 & 40 & Male & Unknown & 2019 & 8 & 25 & 5 & True & 34.0738 & 118.2078 \\ i78 & 11/20/2019 & Central & 128 & 21 & Male & Hispanic & 2019 & 11 & 20 & 3 & False & 34.0492 & 118.2391 \\ i95 & 08/30/2019 & Southwest & 374 & 49 & Male & Black & 2019 & 8 & 30 & 21 & False & 34.0108 & 118.3182 \end{tabular} Let's use Latitutude and Longitude to do a quick analysis of accuracy of location data Cleaning data is iterative process - the Latitude edges to Los Angeles appear to be 34.4 and 33.6 - the Longitude edges appear to be 118.7 and 118.1 - there are some outliers in our make shift map that need to be removed 33] : z1 = pd.read_sq1_query ("SELECT Latitude, Longitude, Division z1.head() FROM traffic", engine) 33] : \begin{tabular}{rrrr} & Latitude & Longitude & Division \\ \hline 0 & 34.0255 & 118.3002 & Southwest \\ 1 & 34.0256 & 118.3089 & Southwest \\ 2 & 34.0738 & 118.2078 & Hollenbeck \\ 3 & 34.0492 & 118.2391 & Central \\ 4 & 34.0108 & 118.3182 & Southwest \end{tabular} 34]: fig, ax = plt.subplots(figsize =(10,10)) ax = sns.scatterplot (x= 'Longitude', y= 'Latitude', hue = "Division", data =z1, legend = 'full' ) SELECT [DISTINCT ALL ]{ [columnExpression [ AS newName ]][,]} FROM TableName [alias] [,] [WHERE condition] [GROUP BY columnList] [HAVING condition] [ORDER BY columnList] SELECT specifies which columns to use FROM specifies which tables to use WHERE filters the rows based on a condition GROUP BY forms groups of rows with the same column value HAVING filters the groups subject to a condition ORDER BY specifies the order of the output Using SELECT for specific fields - can individually pull out specific fields
Step by Step Solution
There are 3 Steps involved in it

Get step-by-step solutions from verified subject matter experts