

Question: python code Plotting with matplotlib and seaborn lib.: Write a Python code to draw a figure of three sets of sine and cosine curves with
python code
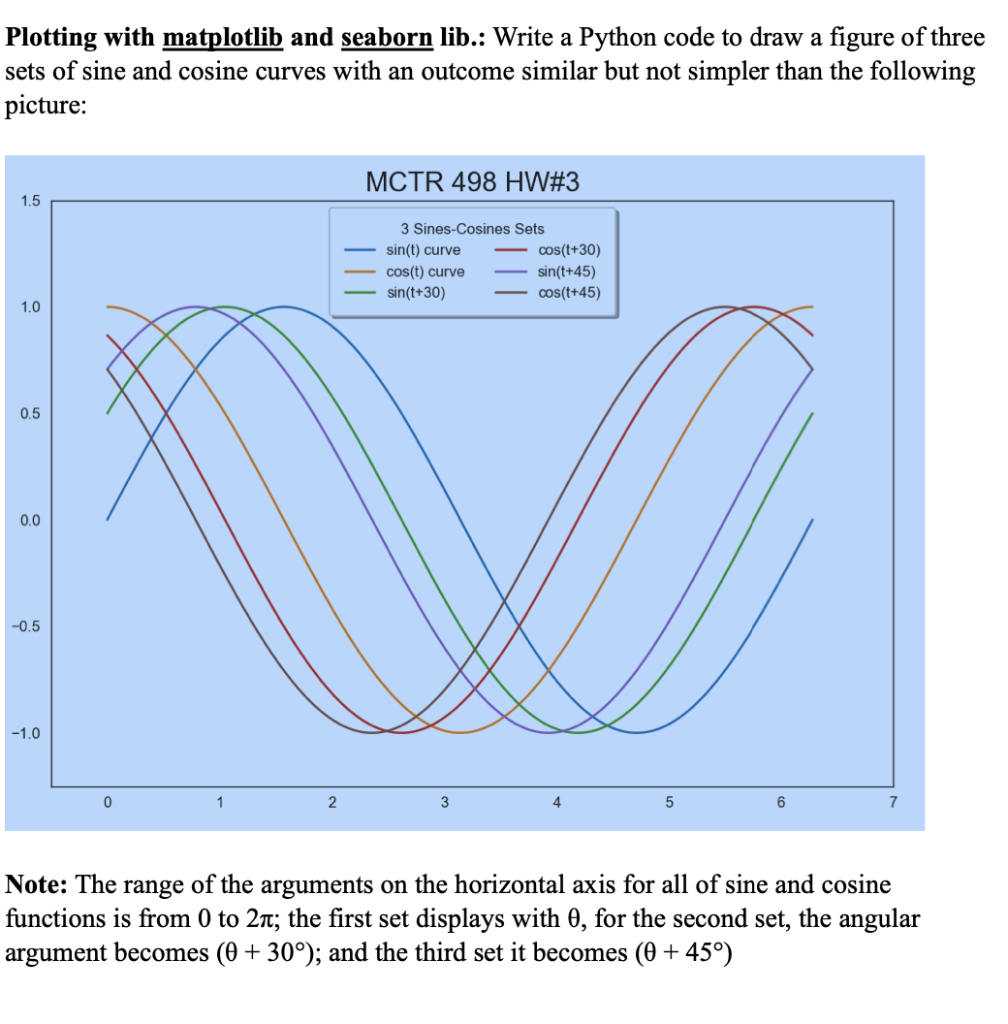
Plotting with matplotlib and seaborn lib.: Write a Python code to draw a figure of three sets of sine and cosine curves with an outcome similar but not simpler than the following picture: Note: The range of the arguments on the horizontal axis for all of sine and cosine functions is from 0 to 2; the first set displays with , for the second set, the angular argument becomes (+30); and the third set it becomes (+45)
Step by Step Solution
There are 3 Steps involved in it
1 Expert Approved Answer
Step: 1 Unlock

Question Has Been Solved by an Expert!
Get step-by-step solutions from verified subject matter experts
Step: 2 Unlock
Step: 3 Unlock