

Question: python code The following data set in the table represents pressure samples, in pounds per square inch (psi), taken in a fuel line once every
 python code
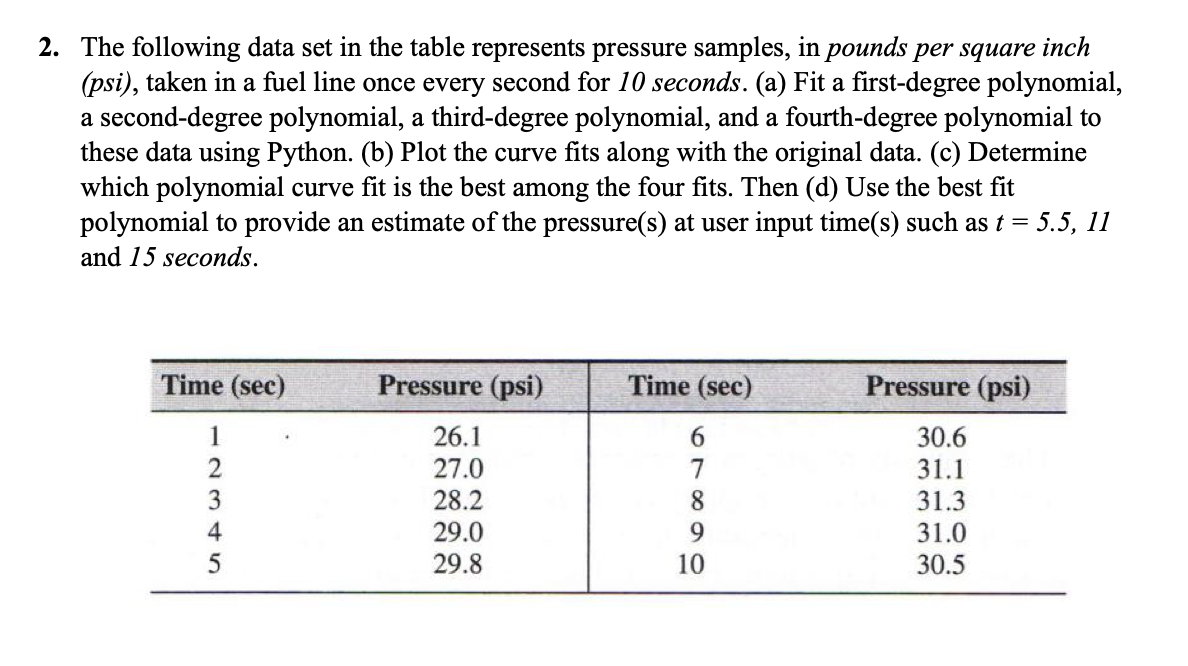
The following data set in the table represents pressure samples, in pounds per square inch (psi), taken in a fuel line once every second for 10 seconds. (a) Fit a first-degree polynomial, a second-degree polynomial, a third-degree polynomial, and a fourth-degree polynomial to these data using Python. (b) Plot the curve fits along with the original data. (c) Determine which polynomial curve fit is the best among the four fits. Then (d) Use the best fit polynomial to provide an estimate of the pressure(s) at user input time(s) such as t=5.5,11 and 15 seconds
Step by Step Solution
There are 3 Steps involved in it
1 Expert Approved Answer
Step: 1 Unlock

Question Has Been Solved by an Expert!
Get step-by-step solutions from verified subject matter experts
Step: 2 Unlock
Step: 3 Unlock