

Question: ****PYTHON CODE Write a function, each of which produces one of the desired graphs. Your functions should take no parameters, and should not return or
****PYTHON CODE
Write a function, each of which produces one of the desired graphs. Your functions should take no parameters, and should not return or print anything. Instead, use the Pandas savefig(FILENAME) method to save your graph to .png file:
line_graph() - Your output file should be called "my_line_graph.png".
should look EXACTLY like this one below:
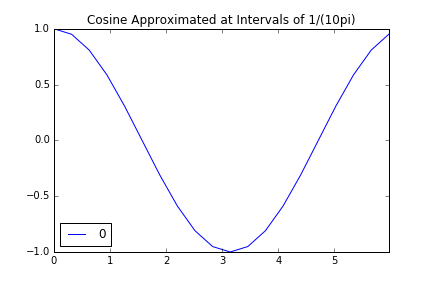
Cosine Approximated at Intervals of 1/(10pi) 0.5 0.0 -0.5 0 4
Step by Step Solution
There are 3 Steps involved in it
1 Expert Approved Answer
Step: 1 Unlock

Question Has Been Solved by an Expert!
Get step-by-step solutions from verified subject matter experts
Step: 2 Unlock
Step: 3 Unlock