

Question: Write a function USING PYTHON, which produces the desired graph. Your function should take no parameters, and should not return or print anything. Instead, use
Write a function USING PYTHON, which produces the desired graph. Your function should take no parameters, and should not return or print anything. Instead, use the Pandas savefig(FILENAME) method to save your graphs to .png files:
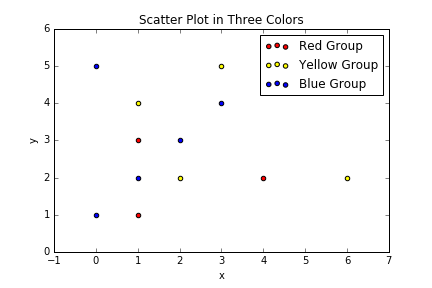
scatterplot() - Your output file should be called "my_scatter_plot.png". (Note: these points are not random and have integer coordinates. You should reproduce them exactly, in the colors given.)
Should look EXACTLY like this:
Scatter Plot in Three Colors Red Group ooo Yellow Group Blue Group 4 -1 0 4 Scatter Plot in Three Colors Red Group ooo Yellow Group Blue Group 4 -1 0 4
Step by Step Solution
There are 3 Steps involved in it
1 Expert Approved Answer
Step: 1 Unlock

Question Has Been Solved by an Expert!
Get step-by-step solutions from verified subject matter experts
Step: 2 Unlock
Step: 3 Unlock