

Question: Python coding question An exercise in straight-line fitting Hote. You will need to have read the lectures and or watched the converting video to attempt
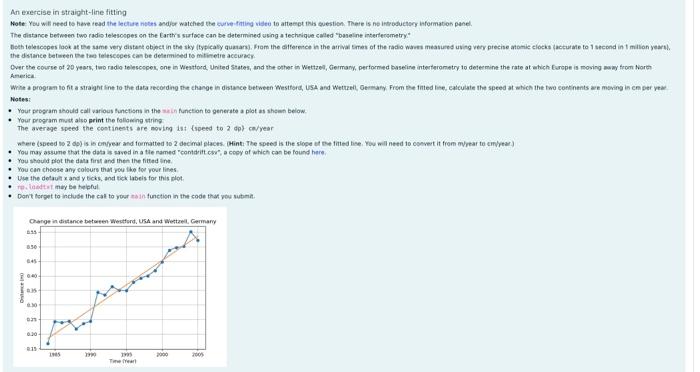
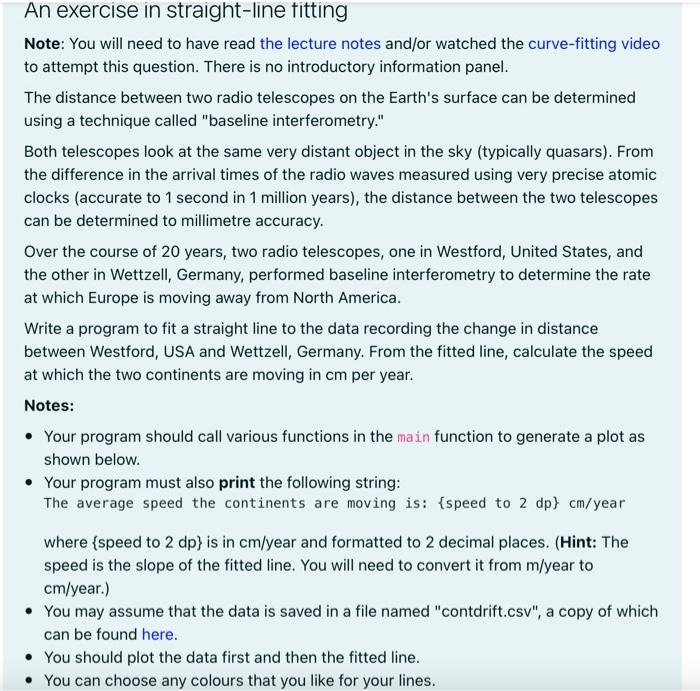
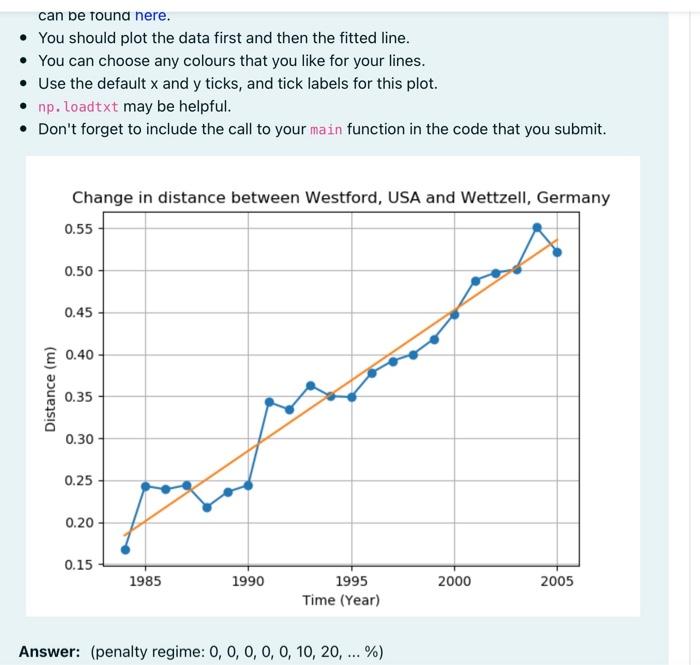
An exercise in straight-line fitting Hote. You will need to have read the lectures and or watched the converting video to attempt this cuestion. There is no introductory information panel The distance between two radio telesopes on the Earth's surface can be determined using a technique called "baneline interferometry Both telescopes look at the same very distant object in the sky (typically quitars. From the difference in the arrival times of the radio waves measured using very precise atomic clocks accurate to 1 second in 1 million yerel the distance between the telescopes can be determined to milimetre accuracy Over the course of 20 years, two radio telescope one in Westford, United States, and the other in Wetzel, Germany, performed baseline interferometry to determine the rate at which Europe is moving away from Nore America Wohe a program to fit a straight line to the data recording the change a distance between Westford, USA and Wettrall, Germany From the inted time, calculate the speed at which the two continents are moving in cm per ve Notes: Your program should call various functions in the skin function to generate a plot as shown below Your program must also print the following string The average speed the continents are nowing 1st speed to 2 dp) ca/year where (speed to Zd) is sentyear and formatted to 2 decimal aces. (Hint: The speed is the slope of the line. You will need to convert it from year to year) You may assume that the data is saved in a tie named "contritt ", a copy of which can be found here You should slot the data first and then the fitted in You can choose any colours that you like for your lines Use the default and y ticks, and tiek labels for this plot rolandt may be helpful Don't forget to include the call to your in function in the code that you subna Change in distance between Westford, USA and Westzell Germany 760 ce 0.JO 315 INS 2005 Tere! An exercise in straight-line fitting Note: You will need to have read the lecture notes and/or watched the curve-fitting video to attempt this question. There is no introductory information panel. The distance between two radio telescopes on the Earth's surface can be determined using a technique called "baseline interferometry." Both telescopes look at the same very distant object in the sky (typically quasars). From the difference in the arrival times of the radio waves measured using very precise atomic clocks (accurate to 1 second in 1 million years), the distance between the two telescopes can be determined to millimetre accuracy. Over the course of 20 years, two radio telescopes, one in Westford, United States, and the other in Wettzell, Germany, performed baseline interferometry to determine the rate at which Europe is moving away from North America. Write a program to fit a straight line to the data recording the change in distance between Westford, USA and Wettzell, Germany. From the fitted line, calculate the speed at which the two continents are moving in cm per year. Notes: Your program should call various functions in the main function to generate a plot as shown below. Your program must also print the following string: The average speed the continents are moving is: {speed to 2 dp} cm/year where (speed to 2 dp} is in cm/year and formatted to 2 decimal places. (Hint: The speed is the slope of the fitted line. You will need to convert it from m/year to cm/year.) You may assume that the data is saved in a file named "contdrift.csv", a copy of which can be found here. You should plot the data first and then the fitted line. You can choose any colours that you like for your lines. can be found nere. You should plot the data first and then the fitted line. You can choose any colours that you like for your lines. Use the default x and y ticks, and tick labels for this plot. np. loadtxt may be helpful. Don't forget to include the call to your main function in the code that you submit. Change in distance between Westford, USA and Wettzell, Germany 0.55 0.50 0.45 0.40 Distance (m) 0.35 0.30 0.25 0.20 0.15 1985 1990 2000 2005 1995 Time (Year) Answer: (penalty regime: 0, 0, 0, 0, 0, 10, 20, ... %)
Step by Step Solution
There are 3 Steps involved in it

Get step-by-step solutions from verified subject matter experts