

Question: python coding Hello with exercise 3 included instructions and example 3. Please help me thank you Lagu jupyter Chapter 05 women Owl Widgets Python Run
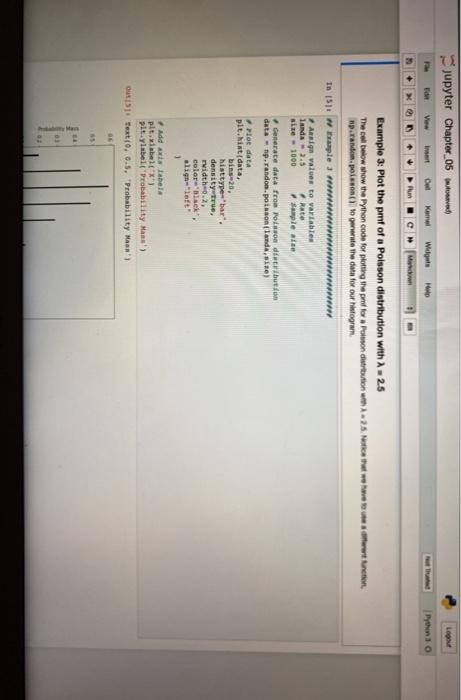
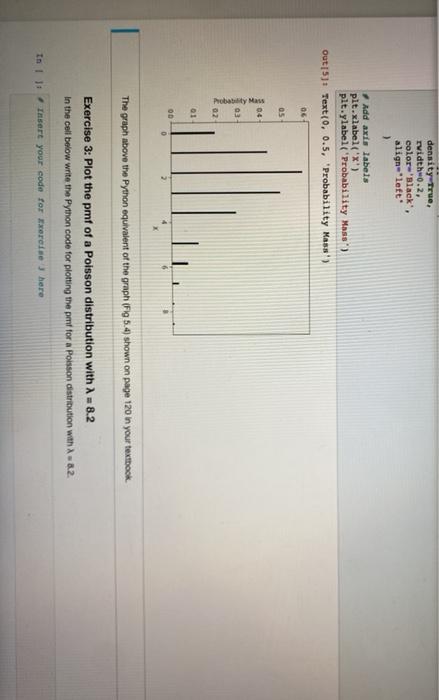
Lagu jupyter Chapter 05 women Owl Widgets Python Run Example 3: Plot the pit of a Poisson distribution with 2 - 2.5 The cell below show the Python code for plotting the prffora Pouson distribution 25. New Rp.rando.poison to generate the data for our histogram In 1511 w plej Asiq value to variables landa 2.5 Rate size - 1000 Sample at Generate data fro Poin distribution data - np.randon.poisson landa size) Po data plt. Mint(data. bis 20. histtyperbar. density true width 0.2 color Black align="left 1 Add axts Labels plt.isbel('') plt.label('Probability Man's 01151. Text(0, 0.5. Probability Man' density True rvidth 0.2, color"Black. align="left" ) Add axis labels pit.xlabel('x') plt.ylabel('Probability Mass) out [5]1 Text(0, 0.5, 'Probability Mass') 06 05 04 Probability Man 02 01 OD . The graph above the Python equivalent of the graph (Fig 1.4) shown on page 120 in your textbook Exercise 3: Plot the pmf of a Poisson distribution with 1 - 8.2 In the cell below write the Python code for plotting the pmf for a Poisson distribution with A82 In 1 1 Insert your code for txeres here
Step by Step Solution
There are 3 Steps involved in it

Get step-by-step solutions from verified subject matter experts