

Question: python Create a function, named myplotfunc that takes the following positional arguments as inputs: A list of numeric for x A list of numeric for
python
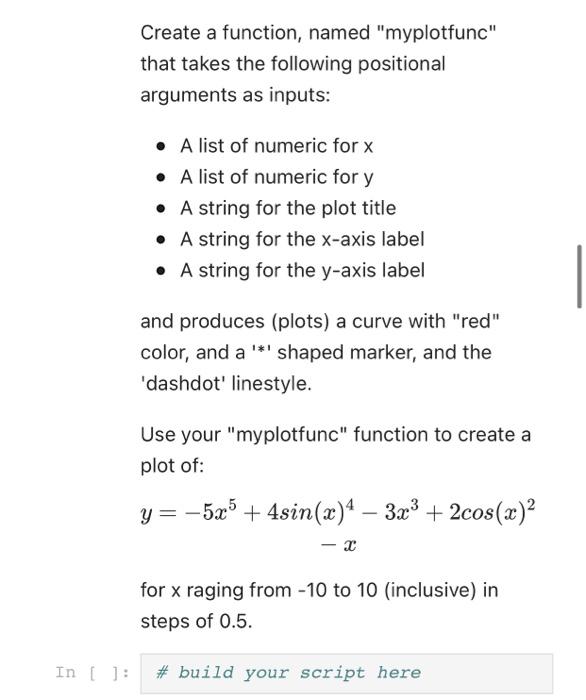
Create a function, named "myplotfunc" that takes the following positional arguments as inputs: A list of numeric for x A list of numeric for y A string for the plot title A string for the x-axis label A string for the y-axis label and produces (plots) a curve with "red" color, and a '*' shaped marker, and the 'dashdot' linestyle. Use your "myplotfunc" function to create a plot of: y= -5x3 + 4sin(x)4 3x3 + 2cos(x)? for x raging from - 10 to 10 (inclusive) in steps of 0.5. In [ ]: # build your script here
Step by Step Solution
There are 3 Steps involved in it
1 Expert Approved Answer
Step: 1 Unlock

Question Has Been Solved by an Expert!
Get step-by-step solutions from verified subject matter experts
Step: 2 Unlock
Step: 3 Unlock