

Question: Python please Create a function, named myplotfunc that takes the following positional arguments as inputs: A list of numeric for x A list of numeric
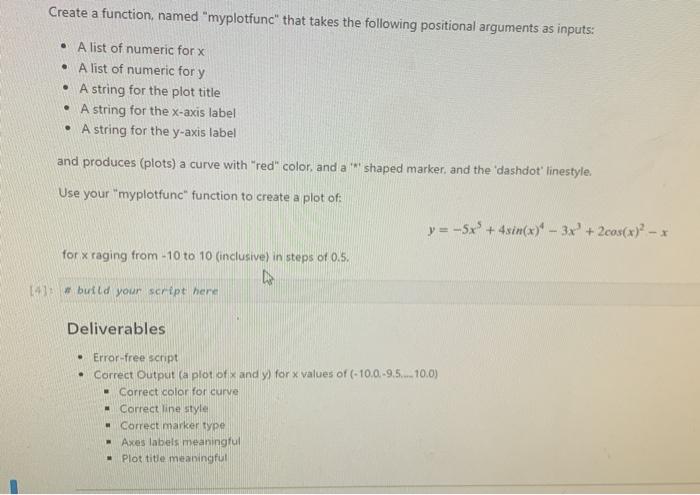
Create a function, named "myplotfunc" that takes the following positional arguments as inputs: A list of numeric for x A list of numeric for y A string for the plot title A string for the x-axis label A string for the y-axis label and produces (plots) a curve with "red" color and a '' shaped marker, and the 'dashdot linestyle. Use your "myplotfunc" function to create a plot of y = -5x + 4xim(x)* - 3x + 2003(x)2 - for x raging from -10 to 10 (inclusive) in steps of 0.5. 14: build your script here Deliverables Error-free script Correct Output (a plot of and y) for x values of (-10,0-9,5.10.0) Carrect color for curve Correct line style - Correct marker type Axes labels meaningful Plot title meaningful
Step by Step Solution
There are 3 Steps involved in it

Get step-by-step solutions from verified subject matter experts