

Question: PYTHON help Objective Create a python program that draws special functions ( Sin, Cos and multiple Gaussian distributions ) using module . Specification: Please define
PYTHON help
Objective
Create a python program that draws special functions (Sin, Cos and multiple Gaussian distributions) using module.
Specification:
Please define a module named drawing to contain different drawing functions:
gauss(x, mean, std): given
DrawSin(x, save_name)
DrawCos(x, save_name)
DrawGMM(x, A, save_name)
where x is a numpy array, A is a dictionary storing many Gaussian distributions where each key-value pair is the mean-standard deviation pair for one Gaussian distribution, and save_name is a string for the figure name to be saved.
For example:
import numpy as np
x = np.linspace(0, 30, 100)
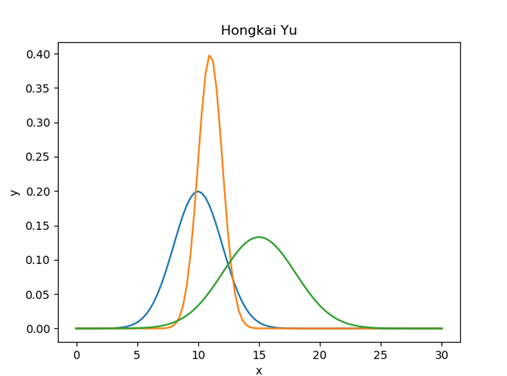
A={10:2, 15:3, 11:1}
save_name='my_test1.png'
Note that: you do not have prior knowledge about the number of Gaussian distributions in A. Hard coding will receive 0 points. You need to write a loop to access each Gaussian distribution in A.
Please use the given test script Lab3.py to call and test the drawing functions in the module of drawing.
Requirements:
You just need to submit your modified drawing.py for grading. Figures are just for your debugging, which are not required for grading.
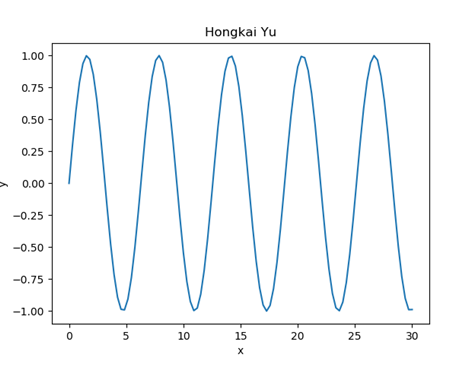
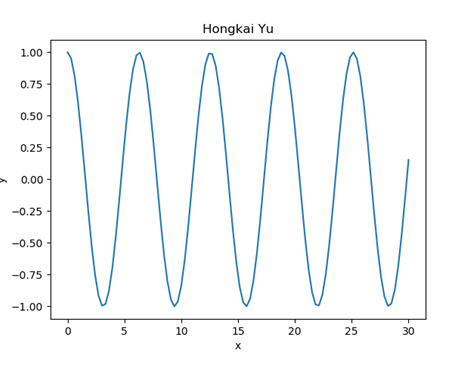
For the generated figures, title is your First Name + Last Name, x-axis is labeled as x, and y-axis is labeled as y.
Please do not modify the function names and arguments (input) for drawing.py.
Example for Generated Figures:
Sin:
Cos:
Drawing when A contains 3 Gaussian distributions:
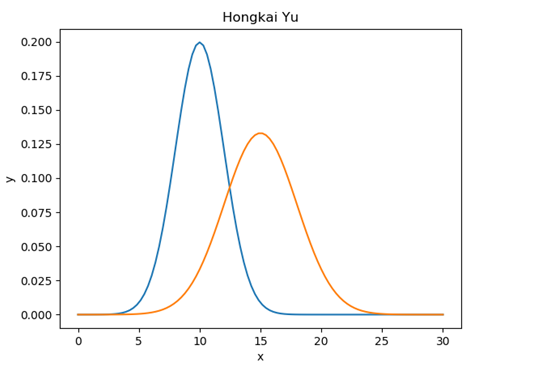
Drawing when A contains 2 Gaussian distributions:
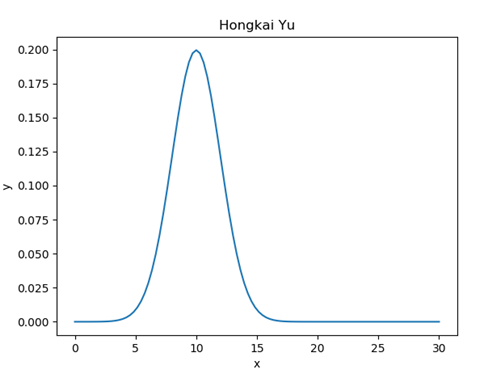
Drawing when A contains 1 Gaussian distribution:
////////////////////////////////////////////////////////////////////////////////////////////////////////////////////////////////////////////////////////////////////////////////////////
##drawing.py
import numpy as np import matplotlib.pyplot as plt #Gaussian distribution def gauss(x, mean, std): return (1.0p.sqrt(2*np.pi*std**2))*np.exp(-(x-mean)**2/(2*std**2)) # draw sin function def DrawSin(x, save_name): # write your code here # draw cos function def DrawCos(x, save_name): # write your code here # draw multiple gaussian together on one figure def DrawGMM(x, A, save_name): # write your code here //////////////////////////////
//////////////////////////////////////////////////////////////////////////////////////////////////////////////////////////////////////////////////////
##Lab3.py
import numpy as np import drawing as dw x = np.linspace(0, 30, 100) # warm up: draw sin(x) and cos(x) dw.DrawSin(x, 'sin.png') dw.DrawCos(x, 'cos.png') # draw multiple Gaussian distributions on one figure A={10:2, 15:3, 11:1} dw.DrawGMM(x, A, 'my_test1.png') B={10:2, 15:3} dw.DrawGMM(x, B, 'my_test2.png') C={10:2} dw.DrawGMM(x, C, 'my_test3.png')Hongkai Yu 1.00 0.75 0.50 0.25 0.00 -0.25 -0.50 -0.75 0 10 15 20 25 30
Step by Step Solution
There are 3 Steps involved in it

Get step-by-step solutions from verified subject matter experts