

Question: python help! so my graph is correct but i want to show it crosses the y axis . i need help adjustinh my code. basically
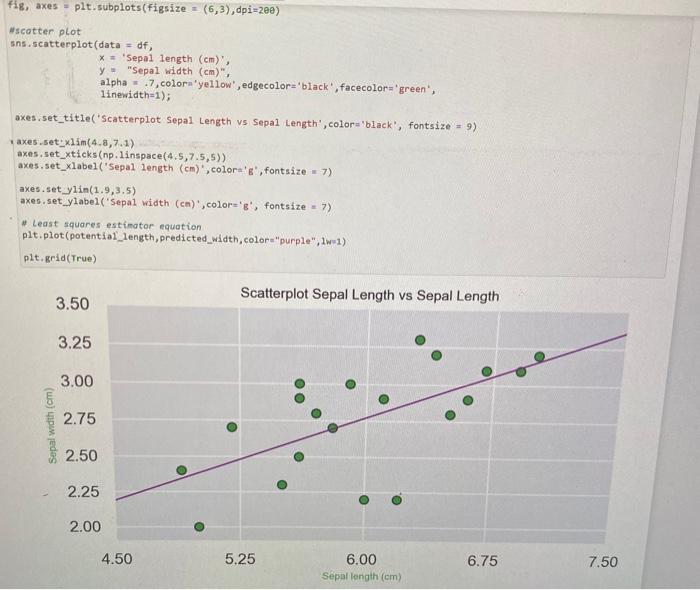
fig, axes - plt.subplots(figsize = (6,3), dpi=2ee) Wscatter plot sns.scatterplot(data = df, * + 'Sepal length (cm)', y"Sepal width (cm)", alpha - .7, colore'yellow', edgecolor='black', facecolor="green, linewidth=1); axes.set_title('Scatterplot Sepal Length vs Sepal Length', color='black', fontsize = 9) axes.set xlim(4.8,7.1) axes,set_xticks(np.linspace(4.5, 7.5,5)) axes.set_xlabel("Sepal length (cm), colores, fontsize 7) axes.set_ylin(1.9,3.5) axes.setylabel('Sepal width (cm)', color='g', fontsize = ) # Least squares estimator equation plt.plot(potential_length, predicted_width,color"purple",1-1) plt.grid(True) Scatterplot Sepal Length vs Sepal Length 3.50 3.25 3.00 Sepal width (cm) 2.75 2.50 2.25 2.00 4.50 5.25 6.75 6.00 Sepal length (cm) 7.50
Step by Step Solution
There are 3 Steps involved in it

Get step-by-step solutions from verified subject matter experts