

Question: PYTHON, I am trying to graph a inputed file. I get the error . This is only for the first row, it seams to print
PYTHON, I am trying to graph a inputed file. 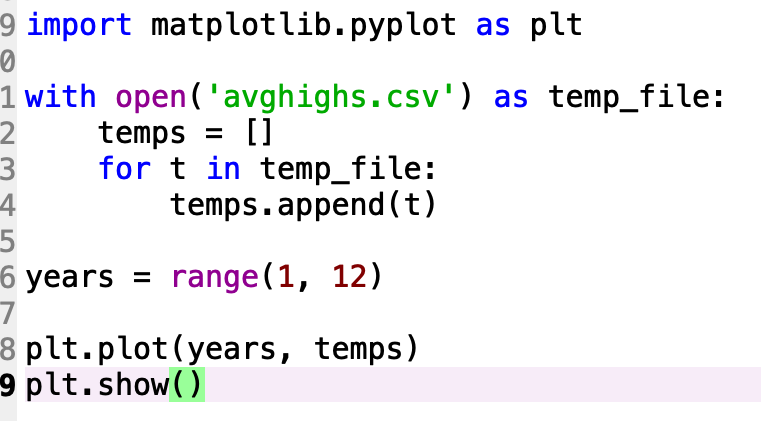 I get the error
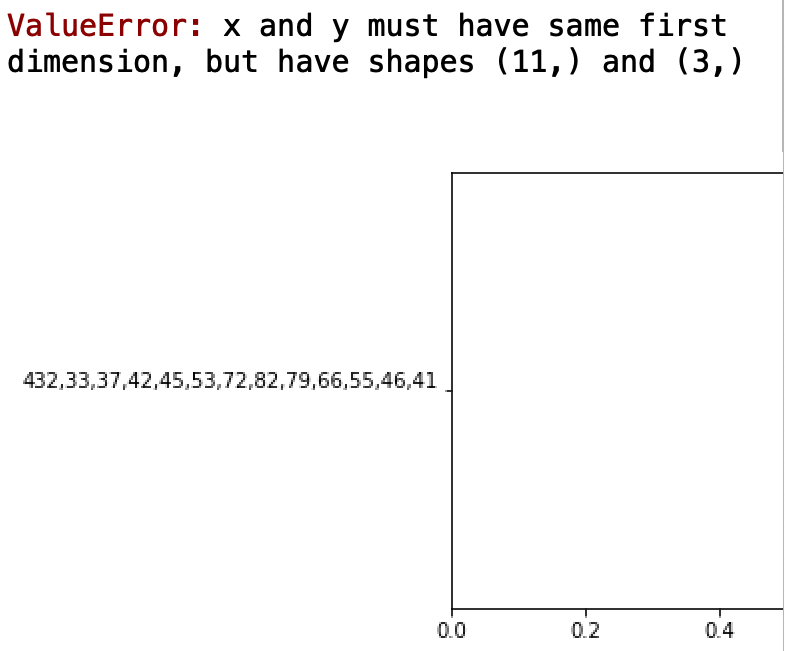 . This is only for the first row, it seams to print the values instead of graphing. Can you please fix this code. The input file looks like
  . You do not have to run the code for me you can just leave hints or recomendations. Thanks
9 import matplotlib.pyplot as plt 1 with open ( 'avghighs.csv') as temp file: 2temps-[l for t in temp_file: temps.append (t) 4 6 years range(1, 12) 7 8 plt.plot(years, temps) 9 plt.show() ValueError: x and y must have same first dimension, but have shapes (11,) and (3,) 432,33,37,42,45,53,72,82,79,66,55,46,41 0.0 0.2 0.4 195 436 687 447 558 9 325 557 562 447 2 4 2 2 395 325 276 475
Step by Step Solution
There are 3 Steps involved in it

Get step-by-step solutions from verified subject matter experts